Excel One Variable Data Table: Quick and Easy Guide

In the world of data analysis, Microsoft Excel provides various tools to streamline processes, and one of the most useful for analyzing how changes in one variable affect outcomes is the One Variable Data Table. Whether you're a seasoned Excel user or just starting out, understanding and utilizing this feature can significantly enhance your ability to make informed decisions based on data. This guide will walk you through creating and interpreting a One Variable Data Table in Excel, ensuring you can apply these techniques to your data scenarios effectively.
What is a One Variable Data Table?
A One Variable Data Table in Excel is used to explore the impact of altering a single variable on one or more calculated results. It's a sensitivity analysis tool that allows you see how different values of an input affect the final output. Here's a brief overview:
- Input Variable: The variable whose values are being changed.
- Output: The result or calculation that changes based on the input variable's values.
When to Use a One Variable Data Table
Consider using a One Variable Data Table when:
- You want to analyze how one variable's change influences multiple outcomes.
- Scenarios need testing for business decisions, like pricing strategies or budget analysis.
- Educational purposes, to understand mathematical functions or economic models.
How to Create a One Variable Data Table
Let's dive into the steps required to set up and use a One Variable Data Table:
1. Set Up Your Worksheet
Begin by structuring your worksheet:
- Place your formula or the calculation you wish to analyze in a specific cell. For instance, suppose you're calculating net profit based on varying units sold. Let’s place the profit formula in cell B10.
- List the variable values you want to test in a column or row. For example, units sold could be listed vertically from A11 to A20.
🛑 Note: Ensure your formula is relative to the variable you're changing, so the table can correctly interpret changes.
2. Highlight the Range
Select the area containing your formula and the variable values:
- Highlight the formula cell (e.g., B10) and the column of variable values (A11:A20), including one blank column to the right or row below for the results.
3. Use the Data Table
Now, configure the Data Table:
- With the range selected, navigate to the Data tab on the Excel Ribbon.
- Click on What-If Analysis and then Data Table.
- In the Column input cell box, enter the cell reference of the variable in your formula. For our example, if units sold is in cell B2, you would enter B2 here.
- Click OK.
4. Interpret the Results
Excel will fill in the results column or row, showing you how the output changes with each new input value. Here's what you'll see:
- The column adjacent to or the row below your variable list will now contain the calculated results based on each value.
- You can analyze the pattern or trend in the output to make decisions or forecasts.
🧠 Note: Understanding how to read the output is crucial. Look for trends or points where the outcome significantly changes.
Tips for Effective Use
- Label Your Table: Ensure your data table is clearly labeled so that anyone can understand what the variable and results represent.
- Sort Your Data: Arrange your variable values in ascending or descending order to make trend analysis easier.
- Use Absolute References: When creating complex formulas, consider using absolute cell references ($A$1) where necessary to keep references constant.
Expanding Analysis with Multiple Variables
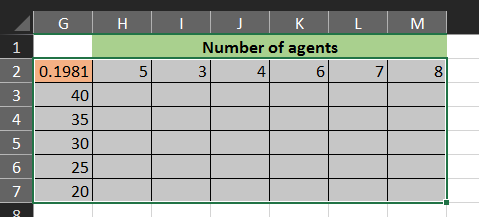
Although this guide focuses on one variable, Excel also offers Two-Variable Data Tables. These are useful when you need to analyze how changes in two variables simultaneously affect an outcome:
- Set up a grid where one variable is in a column and the other in a row.
- The intersection of these variables will show the result of both variables changing together.
Final Thoughts
Excel's One Variable Data Table is an invaluable tool for anyone looking to analyze the impact of a single changing variable on a set of results. By mastering this technique, you can:
- Make informed business decisions by understanding potential outcomes.
- Test and optimize your formulas.
- Enhance your understanding of mathematical relationships in data.
As you grow more familiar with Excel's capabilities, consider exploring other data analysis tools like scenarios, Goal Seek, or Solver for even more complex analysis. With practice, your proficiency in data analysis will grow, enabling you to extract more insights from your data than ever before.
Can I use a One Variable Data Table for multiple calculations?
+Yes, you can set up a One Variable Data Table to change one variable and see how it affects multiple calculations or outcomes. Just ensure your formula references are adjusted appropriately.
What if my variable isn’t changing in a linear fashion?
+A One Variable Data Table can still be used. It will show how the output changes with each new input value, regardless of whether the change is linear or not.
Can I include non-numeric variables in a One Variable Data Table?
+One Variable Data Tables are designed for numeric variables. If you need to test non-numeric scenarios, consider using scenarios or pivot tables.
Related Terms:
- Sample data table for Excel
- One variable data table Excel
- One variable sensitivity table Excel
- Two variable data table Excel
- Data Table formula in Excel
- 1 variable table in excel


