Calculating Percentage Change in Excel Made Simple

Ever needed to find out how much something has grown or shrunk in Excel? Whether you're tracking stock prices, monitoring sales growth, or measuring a drop in expenses, calculating percentage change is an essential skill. This guide will simplify the process, ensuring you can compute these changes with ease and accuracy in Microsoft Excel.
Understanding Percentage Change
Percentage change indicates how much a value has changed relative to the original value. It’s used in finance, business analytics, and even everyday scenarios to gauge growth or decline.

The Basic Formula for Percentage Change
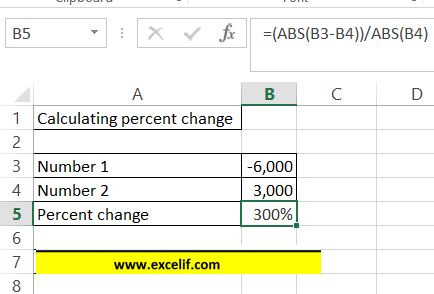
The formula for calculating percentage change in Excel is straightforward:
Percentage Change = ((New Value - Old Value) / Old Value) * 100
This formula helps you express the change as a percentage of the original value. Let's break it down:
- New Value: The current figure you're working with.
- Old Value: The baseline or initial figure from which the change is measured.
- Subtract the old value from the new value, divide by the old value, and then multiply by 100 to get the percentage.
Setting Up Your Excel Sheet
Let's say you have stock prices of a company for two different dates. Here’s how to set up your Excel sheet:

| Date | Stock Price ($) |
|---|---|
| Jan 1, 2023 | 50 |
| Feb 1, 2023 | 75 |
Now, let's calculate the percentage change from January to February:
Calculating Percentage Change in Excel
Here are the steps:
- In an empty cell (say C3), type:
- Press Enter. You’ll get a result like this:
=((B3-B2)/B2)*100
| Date | Stock Price ($) | Percentage Change (%) |
|---|---|---|
| Jan 1, 2023 | 50 | |
| Feb 1, 2023 | 75 | 50 |

ℹ Note: Be sure to keep the same cell references throughout for consistent calculations.
Handling Negative Percentage Change
Not all changes are positive. If the new value is less than the old value, you’ll have a negative percentage change:
| Date | Stock Price ($) | Percentage Change (%) |
|---|---|---|
| Jan 1, 2023 | 50 | |
| Feb 1, 2023 | 40 | -20 |
Excel will automatically display negative percentages with a minus sign.
Using Percentage Change for Data Analysis
Calculating percentage change can reveal trends, growth rates, or declines in your data:
- Track monthly sales growth or decline
- Analyze investment returns
- Measure changes in expenses, revenue, or any key metric over time
When dealing with larger datasets:

Use conditional formatting to highlight significant changes:
- Select the cells with the percentage changes
- Go to Home > Conditional Formatting > New Rule...
- Choose “Format only cells that contain”
- Set the rule to format cells where the cell value is greater than (or less than) a certain percentage
Advanced Techniques
Let's look at how to automate and expand your percentage change calculations:
- Using Formulas: For recurring calculations, use formulas to automatically compute percentages in a column.
- Conditional Formatting: Color-code changes to quickly identify patterns or outliers.
- Percentage Change Over Time: Use pivot tables or formulas to calculate changes over multiple periods.
- Sparklines: Visualize trends with small graphs in cells, adding a visual layer to your data.

Summing up, the ability to calculate percentage changes in Excel is invaluable for understanding how data evolves over time. From simple stock price changes to complex data analysis, this fundamental skill enhances your data interpretation abilities. With the steps provided, you can now confidently navigate through Excel to analyze trends, make informed decisions, and convey data-driven insights more effectively.
Why would I use percentage change instead of absolute change?
+
Percentage change provides a more meaningful measure of change, especially when dealing with values of different magnitudes. It allows for a relative comparison that an absolute change might not reveal, making it easier to see trends or proportions.
Can I automate percentage change calculations in Excel?
+
Absolutely. You can create formulas to automatically calculate percentage changes across rows or columns, making your analysis more efficient.
What are some common mistakes when calculating percentage change in Excel?
+
Common errors include: not multiplying by 100 to get the percentage, subtracting values in the wrong order, and forgetting to reference cells correctly in formulas.
How can I check if my percentage change calculation is correct?
+
Manually verify the calculation or use a different method like online calculators to compare results. Also, ensure your formula is referencing the right cells.
Can percentage change be used for predictive analytics?
+
While it shows trends and can help in forecasting based on historical data, predictive analytics often involves more complex models and external variables.
Related Terms:
- Percentage change formula Excel
- Percentage change calculator
- Format percentage Excel
- Percentage increase formula Google Sheets
- percentage of value difference excel
- percentage growth formula excel


