Descriptive Statistics Made Easy in Excel

Understanding data is crucial in various fields, from business analytics to scientific research. One of the foundational tools for analyzing data is descriptive statistics. These statistics help summarize and describe the key features of a dataset, providing a quick snapshot of what's going on within the numbers. In this detailed guide, we'll walk through how to easily perform descriptive statistics in Excel, transforming complex datasets into comprehensible information.
Understanding Descriptive Statistics
Descriptive statistics provide simple summaries about the sample and the measures. Here are the primary types:
- Measures of Central Tendency: Mean, median, and mode.
- Measures of Dispersion: Variance, standard deviation, and range.
- Distribution Shape: Skewness and kurtosis.
- Measures of Position: Quartiles, percentiles, and z-scores.
Calculating Central Tendency in Excel
Mean (Average)
The mean is perhaps the most commonly known measure of central tendency. To calculate it in Excel:
- Select the cell where you want the result.
- Enter
=AVERAGE([Your Data Range]). For example,=AVERAGE(A2:A100).

💡 Note: The AVERAGE function works with both numeric values and cells containing numbers. Blank cells and text are ignored.
Median
The median represents the middle value in a dataset when ordered. Here's how to find it:
- Choose the destination cell for your median value.
- Type
=MEDIAN([Your Data Range]), like=MEDIAN(A2:A100).
Mode
The mode is the most frequently occurring value in your dataset. Here’s how to get it:
- Select a cell for the result.
- Use
=MODE.SNGL([Your Data Range])for the single mode or=MODE.MULT([Your Data Range])for multiple modes.
Measures of Dispersion
Standard Deviation
To measure how spread out numbers are, you can calculate the standard deviation with:
- Enter
=STDEV.S([Your Data Range])for a sample or=STDEV.P([Your Data Range])for a population.

| Function | Description |
|---|---|
STDEV.S |
Sample Standard Deviation |
STDEV.P |
Population Standard Deviation |
Variance
Similar to standard deviation, but without taking the square root:
- Use
=VAR.S([Your Data Range])or=VAR.P([Your Data Range]).
Range
The difference between the largest and smallest value in your dataset:
- Write
=MAX([Your Data Range]) - MIN([Your Data Range])to find the range.
Distribution Shape Analysis
Skewness
Skewness indicates how symmetrical the distribution is. In Excel:
- Input
=SKEW([Your Data Range]).
Kurtosis
To measure the tailedness or peakedness of the distribution:
- Use
=KURT([Your Data Range]).
Measures of Position
Quartiles
To divide data into quarters:
- 1st Quartile:
=QUARTILE.INC([Your Data Range], 1) - 2nd Quartile (Median):
=QUARTILE.INC([Your Data Range], 2) - 3rd Quartile:
=QUARTILE.INC([Your Data Range], 3)
Percentiles
For specific percentiles:
- Enter
=PERCENTILE.INC([Your Data Range], [Percentile Value]), like=PERCENTILE.INC(A2:A100, 0.75)for the 75th percentile.
💡 Note: Percentiles and quartiles use INC for inclusive interpolation; use .EXC for exclusive calculation when appropriate.
Advanced Techniques
Descriptive Statistics Wizard
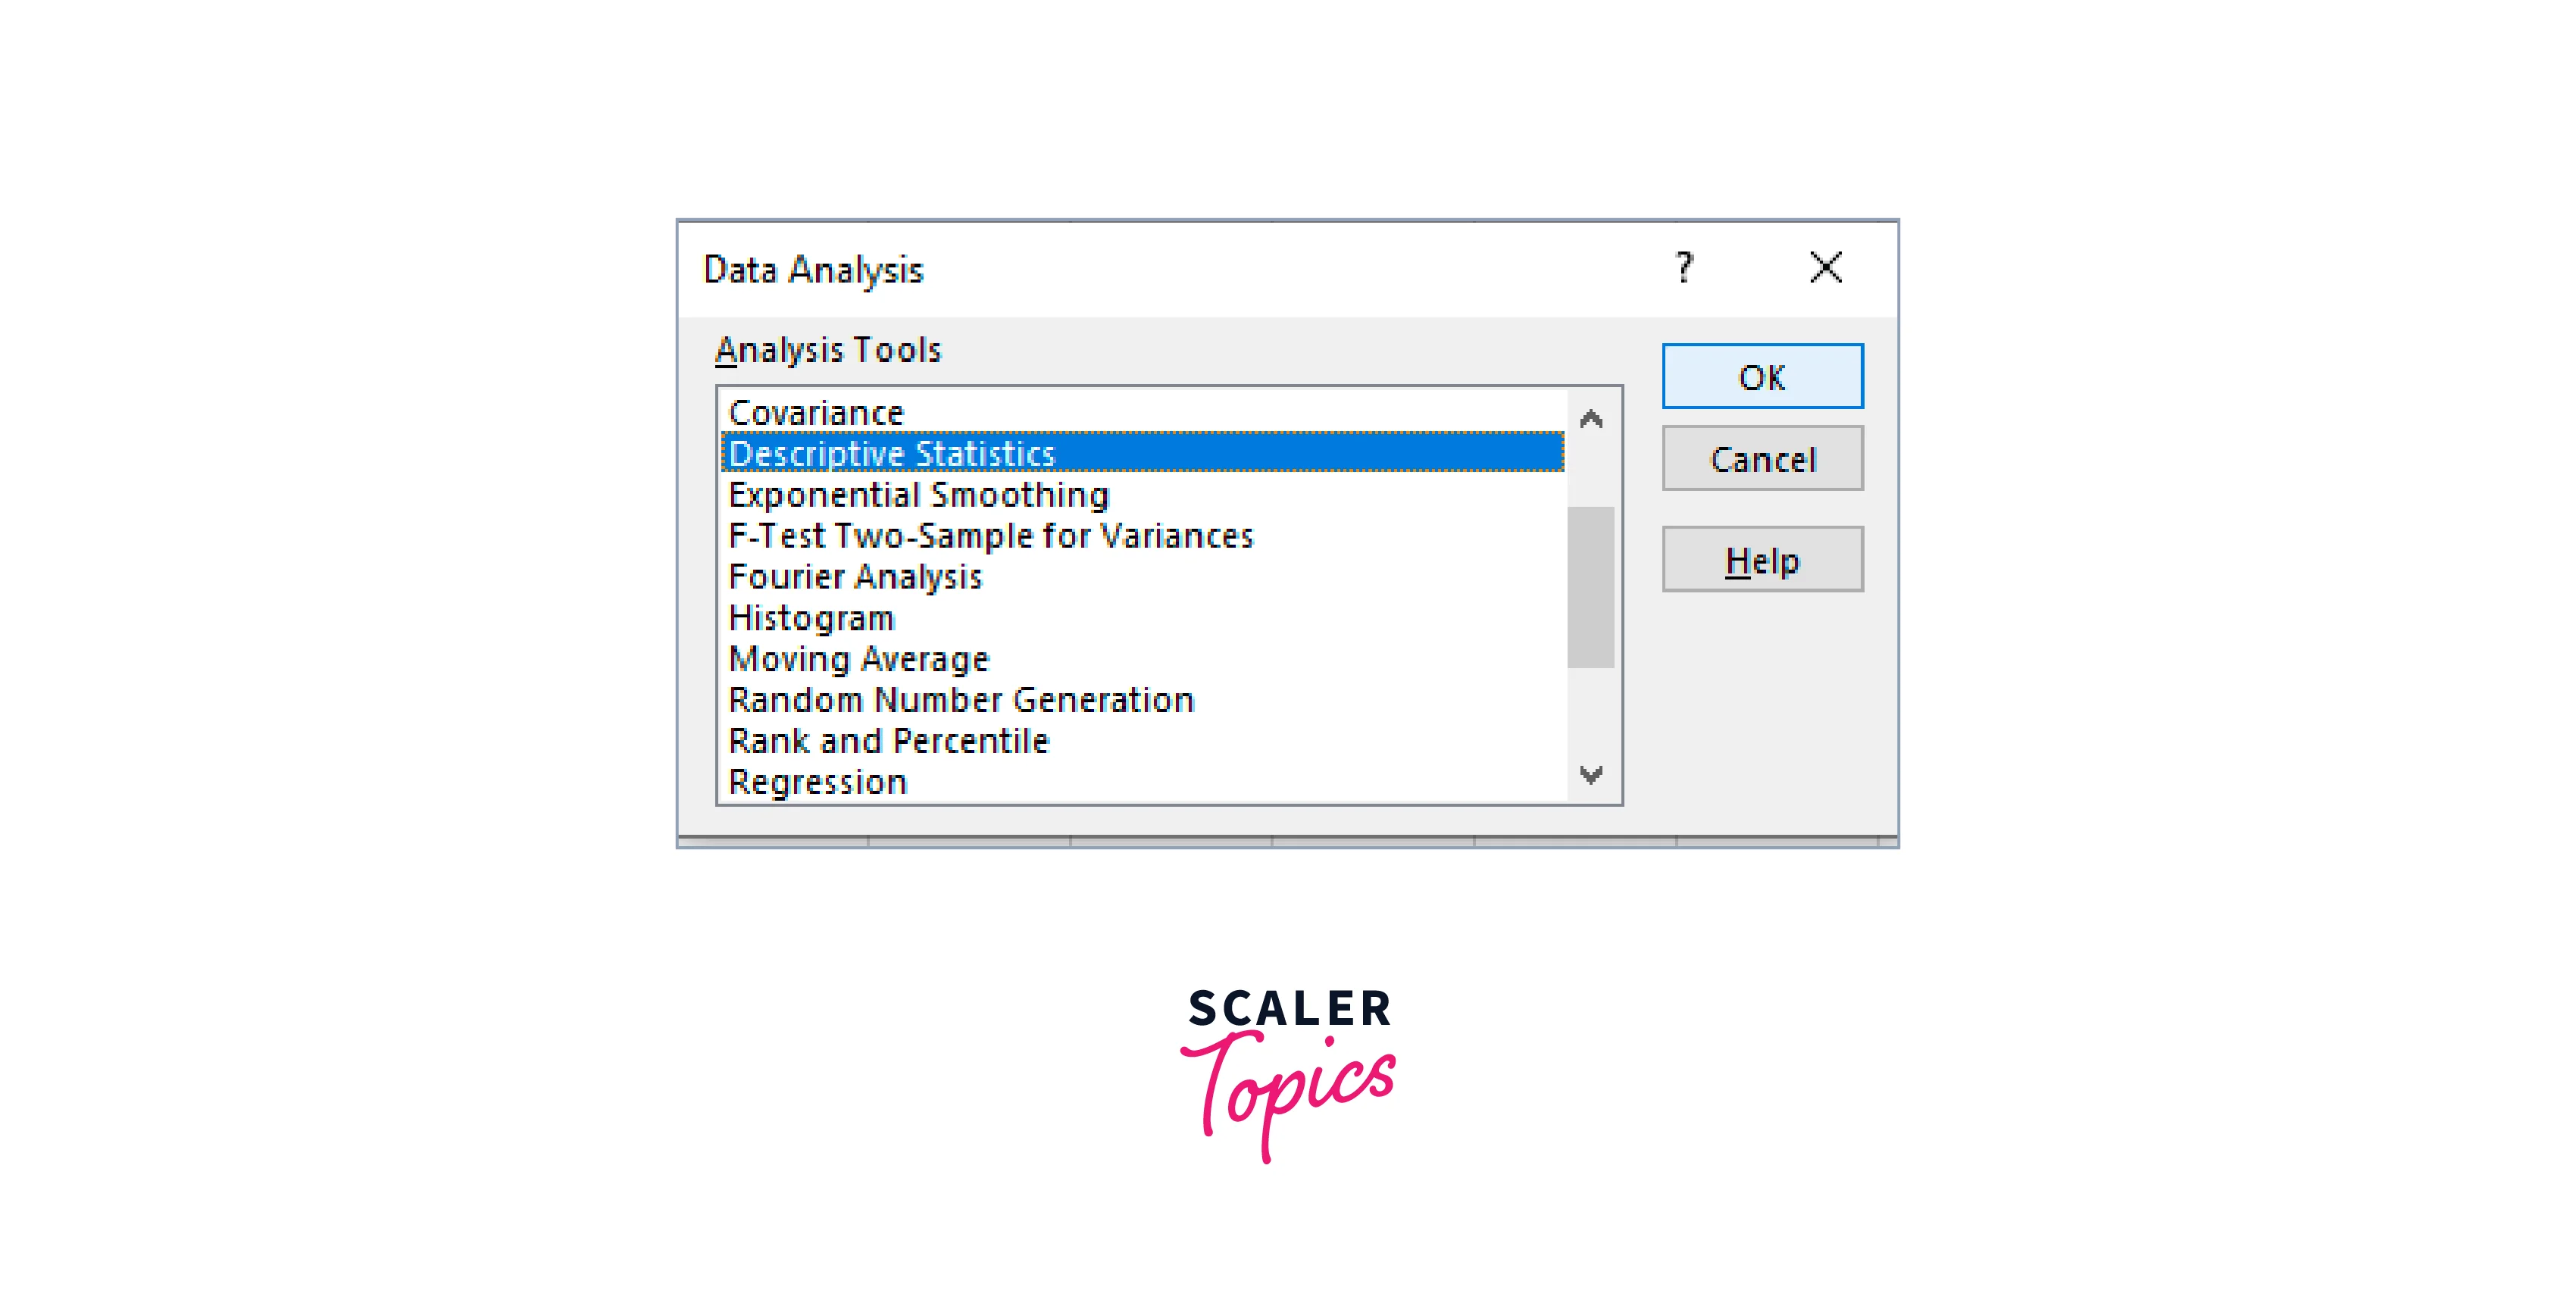
Excel offers a built-in tool to calculate all these statistics:
- Go to 'Data' > 'Data Analysis.'
- Select 'Descriptive Statistics.'
- Choose your input range, output options, and statistics you want to include.
Wrapping Up
Descriptive statistics in Excel are not just about numbers; they tell a story of your data's behavior, giving you insights into patterns, trends, and anomalies. By leveraging Excel’s powerful functions, you can dissect datasets effortlessly, making it an essential tool for data analysis. From calculating basic measures like mean and median to analyzing the distribution shape through skewness and kurtosis, Excel enables you to make informed decisions based on robust statistical analysis.
What is the difference between STDEV.S and STDEV.P?
+STDEV.S calculates the standard deviation for a sample of the population, whereas STDEV.P computes it for the entire population. Use STDEV.S when your data is a sample and STDEV.P when it represents the whole population.
How do I interpret skewness in my dataset?
+A positive skewness indicates that the data is skewed to the right (tail on the right side), and a negative skewness shows a left skew (tail on the left). A skewness of zero means the distribution is approximately symmetrical.
Why does the mean differ from the median?
+The mean is sensitive to outliers and extreme values, while the median is not. This means if your dataset has significant outliers, the mean will be pulled towards them, causing it to differ from the median, which represents the middle value.
Can Excel calculate descriptive statistics for text data?
+Excel primarily focuses on numerical data for descriptive statistics, but text analysis functions like COUNTIF, UNIQUE, and FREQUENCY can provide insights into text data distribution and occurrences.
Is there a limit to how much data Excel can handle for descriptive statistics?
+Excel can manage large datasets for descriptive statistics up to its worksheet and RAM limitations. However, for very large datasets, you might encounter performance issues or might need to consider more specialized software.
Related Terms:
- Descriptive statistics Excel multiple columns
- Descriptive Statistics in Excel PDF
- Descriptive statistics in Excel 365
- Descriptive statistics Excel 2024
- Descriptive statistics in Excel Interpretation
- descriptive statistics formula excel


