Discover How to Calculate P Value Easily with Excel

Understanding the P value is crucial for anyone involved in statistical analysis, especially in fields like research, academia, and business analytics. In this blog post, we'll explore how to calculate the P value easily using Microsoft Excel, a tool many are already familiar with.
What is the P Value?
The P value, or probability value, is a statistical measure that helps you determine the significance of your results. It tells you how likely it is that any observed difference or relationship in your data occurred by random chance.
- High P value: Suggests weak evidence against the null hypothesis, indicating that the observed effect might not be significant.
- Low P value: Indicates strong evidence against the null hypothesis, suggesting that the observed effect is statistically significant.
How to Calculate P Value in Excel?
Let's dive into the steps required to calculate P value using Excel:
Step 1: Gather Your Data
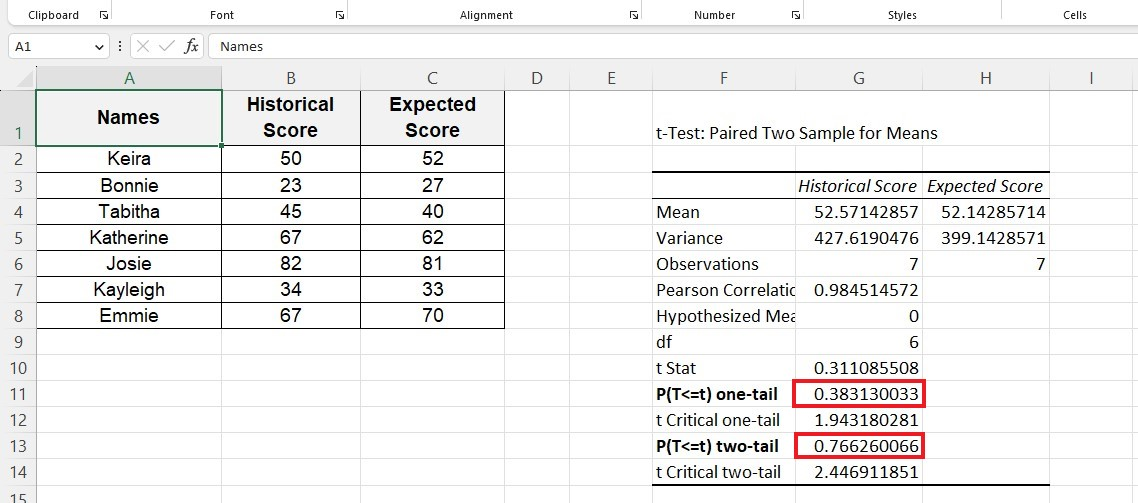
- Open Excel and input your dataset in two columns, one for each variable you want to compare. For example, Column A might be pre-test scores, and Column B post-test scores.
Step 2: Perform a T-test
We'll use the T-test function to compare the means of two independent groups:
- Select an empty cell.
- Enter the following formula:
=T.TEST(array1,array2,tails,type)where:array1andarray2are your data ranges (e.g., A1:A30 and B1:B30).tailscan be 1 or 2 for one-tailed or two-tailed test respectively.typeis 1 for paired, 2 for two-sample equal variance, and 3 for two-sample unequal variance.
- Press Enter to get the P value.
📘 Note: Ensure your data does not contain any missing or non-numeric values as this could skew your results.
Step 3: Interpreting Your Results
After performing the T-test, you need to interpret the P value:
- If P ≤ 0.05: You can reject the null hypothesis, indicating a statistically significant difference.
- If P > 0.05: The result is not statistically significant, suggesting you fail to reject the null hypothesis.

| P value | Statistical Significance |
|---|---|
| 0.001 | Very significant |
| 0.01 | Significant |
| 0.05 | Marginally significant |
| 0.10 | Not significant |
💡 Note: In research, the threshold for significance (alpha level) is often set at 0.05, but this can vary depending on the context.
Real-World Applications of Calculating P Value
Calculating P value in Excel isn't just theoretical; it has practical applications:
- Medical Research: To compare the effectiveness of treatments.
- Marketing: To analyze consumer behavior changes or campaign impact.
- Education: Evaluating the impact of teaching methods on student performance.
Understanding how to calculate the P value can streamline your data analysis, making it easier to make data-driven decisions. Here's a summary of the key points:
- Excel is an accessible tool for statistical analysis: With basic functions like T.TEST, you can calculate P values without complex software.
- Interpretation matters: Knowing how to interpret the P value helps in making informed decisions based on your statistical tests.
- Real-world relevance: The calculation of P value is vital across multiple disciplines for assessing the validity of hypotheses.
Can I use Excel to calculate P value for non-normal distributions?
+Excel’s T.TEST function assumes normality, but you can use non-parametric tests like the Mann-Whitney U test for non-normal distributions, which are not directly supported in Excel’s standard functions. You might need additional tools or add-ins for these tests.
What if I have more than two groups to compare?
+For multiple group comparisons, consider using ANOVA in Excel, which analyzes variance among groups. This can be followed by a post-hoc test for detailed pairwise comparisons if necessary.
How do I handle tied values in a test for significance?
+When dealing with tied values, consider using a test like the Wilcoxon signed-rank test, which can handle ties, or modify your approach with special adjustments for tied data.
Is there a way to simulate P values for hypothesis testing?
+Yes, using Monte Carlo simulations or bootstrap methods within Excel, you can simulate P values by randomly resampling your data multiple times to approximate the distribution of the test statistic under the null hypothesis.
Related Terms:
- Pvalue Excel
- Excel Trendline p-value
- p value t test excel
- p value formula for excel
- excel correlation p value
- getting p value in excel


