Calculate P-Value in Excel Easily: Quick Guide
Let's dive into a critical aspect of statistical analysis that's pivotal for decision-making in various fields from science to finance - calculating the P-value. This quick guide is tailored for those seeking an understanding of how to compute P-values using Microsoft Excel, making complex analysis accessible without delving into complex formulas or software.
What is a P-Value?
The P-value, or probability value, measures the strength of the evidence against a null hypothesis. In simpler terms:
- It indicates if your results are significant.
- A lower P-value suggests stronger evidence against the null hypothesis.
Why Calculate P-Value?
Here's why knowing how to calculate the P-value is useful:
- To validate research findings.
- To determine the significance of results in A/B testing.
- For quality control in manufacturing.
- To analyze statistical data from surveys, experiments, or observational studies.
The Basics of P-Value Calculation
P-values are often calculated from test statistics derived from datasets, comparing them to a known distribution (like the normal distribution). Here's a streamlined approach:
- Collect your sample data and choose the appropriate statistical test.
- Calculate the test statistic using Excel's functions.
- Find the corresponding P-value using Excel's built-in functions or manual methods.
Calculating P-Value in Excel
Excel's functions make this process straightforward:
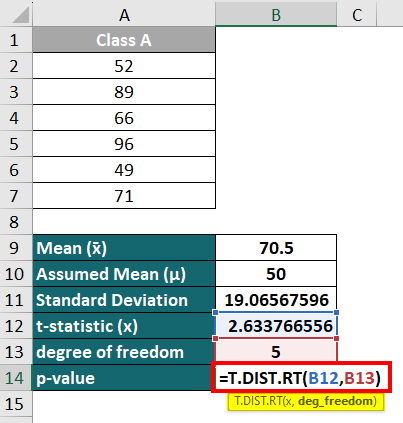
- TDIST: For t-tests.
- NORM.S.DIST: For z-tests, to find the cumulative distribution function.
- CHISQ.DIST.RT: For Chi-Square tests.
Example: T-Test
Let's walk through a t-test:
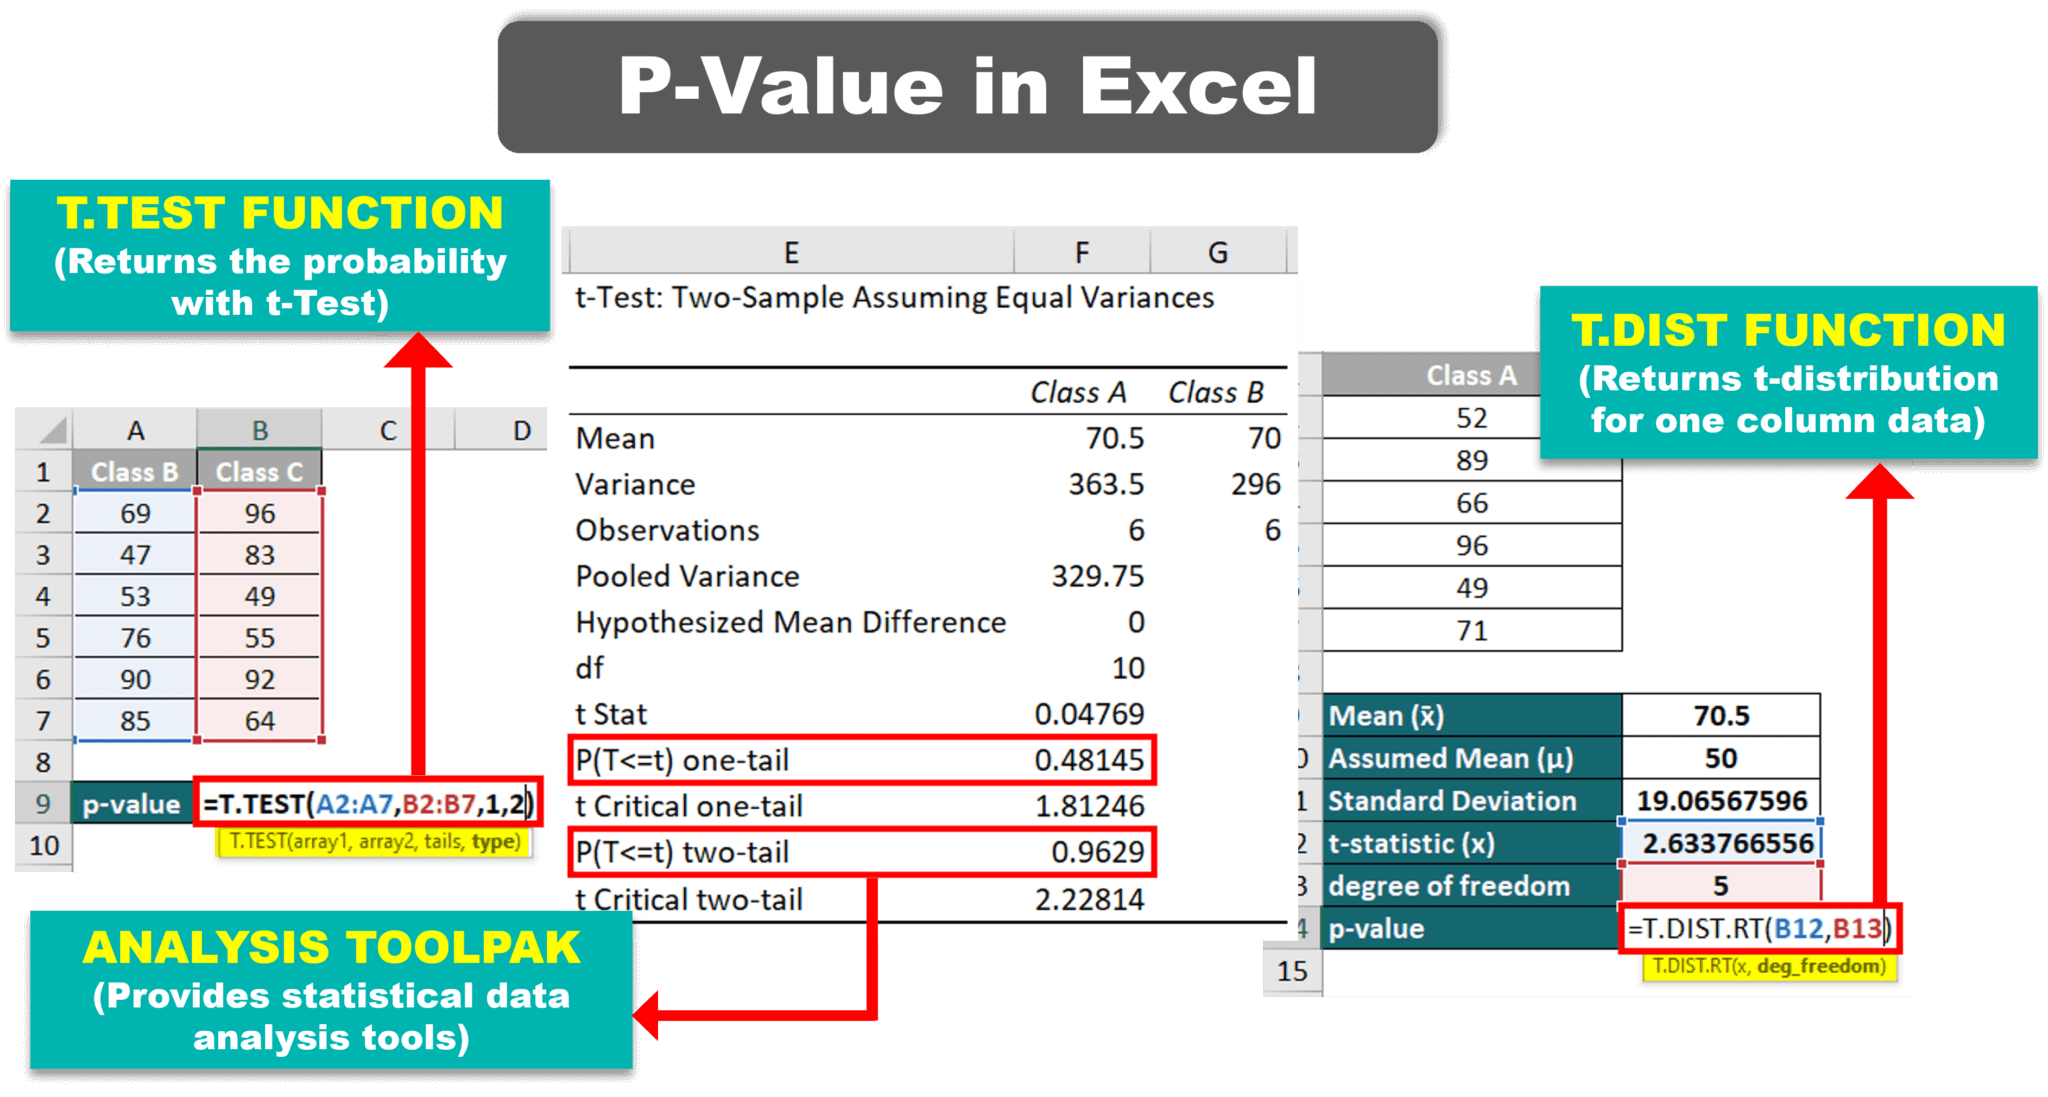
| Step | Description |
|---|---|
| 1 | Enter your data into Excel. Assume you have two sets of data, one in columns A and B. |
| 2 | Calculate the mean, standard deviation, and sample sizes: |
=AVERAGE(A2:A10), =STDEV(A2:A10), =COUNTA(A2:A10) |
|
| 3 | Compute the t-statistic: |
=TDIST(ABS((AVERAGE(A2:A10)-AVERAGE(B2:B10))/SQRT((STDEV(A2:A10)^2/COUNTA(A2:A10))+(STDEV(B2:B10)^2/COUNTA(B2:B10))), COUNTA(A2:A10) + COUNTA(B2:B10) - 2, TRUE) |
|
| 4 | The P-value is now in your cell: |
| Analyze whether your P-value indicates significance. |
⚠️ Note: The calculation in Step 3 assumes an unpaired, two-tailed t-test. Adjust the formula for different tests.
Example: Z-Test
Use the following steps for a z-test:
- Calculate the sample mean and standard deviation.
- Use the formula for z-test:
=NORM.S.DIST(ABS((Sample_Mean - Population_Mean)/Standard_Error), TRUE) - Multiply by 2 if you're performing a two-tailed test.
Alternative: Data Analysis Toolpak
Excel's Data Analysis Toolpak offers an alternative:
- Activate the Toolpak under Add-Ins if not already.
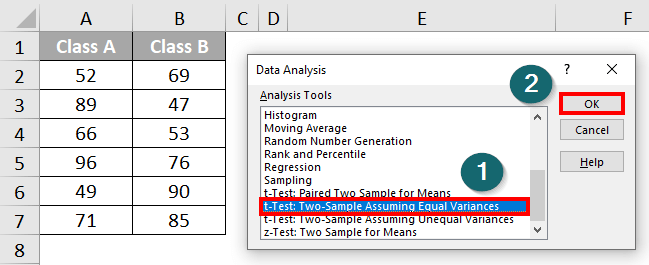
- Go to Data > Analysis > t-Test or z-Test.
- Enter your data ranges and choose the appropriate test parameters.
- The P-value is displayed in the output section.
Important Considerations
Calculating P-values isn't just about pressing buttons:
- Understand the statistical test you're conducting.
- Make sure your data meets the assumptions of the test.
- A P-value alone isn't conclusive; consider effect size, confidence intervals, and practical significance.
After delving into the world of P-values with Excel, let's reflect on the journey:
In this guide, we’ve explored the essence of P-values, their calculation, and how Excel can facilitate this process. Excel’s functions provide a user-friendly interface for statistical analysis, making data-driven decisions more accessible. Remember that understanding what your P-value signifies in the context of your study or analysis is crucial. Keep in mind that:
- A low P-value doesn’t confirm the alternate hypothesis, it just suggests that the null might not hold.
- Significance levels are traditionally set at 0.05, but this can be adjusted based on your research.
- It’s essential to interpret P-values within the framework of your entire analysis.
How do I interpret a P-value?
+A P-value indicates the probability of obtaining results as extreme as your observed data, assuming the null hypothesis is true. A low P-value (typically less than 0.05) suggests that your results are unlikely under the null hypothesis, potentially leading you to reject it in favor of the alternative hypothesis.
What is the difference between a one-tailed and a two-tailed test?
+A one-tailed test looks for changes in a specific direction, while a two-tailed test checks for any change regardless of direction. In Excel, you might need to adjust your formula or the test parameters to reflect which type of test you’re running.
Why does Excel calculate a t-test differently from other software?
+Excel uses a slightly different calculation method or assumptions for tests like the t-test, which might lead to small discrepancies in P-values when compared with other statistical software. Understanding the underlying formulas or opting for the Data Analysis Toolpak can provide more consistent results.
Related Terms:
- P value Excel
- P-value Excel formula
- P value Correlation in Excel
- Kalkulator p-value
- T-value calculator
- Mencari nilai p value
