Calculate P-Value in Excel: Simple Steps

In this guide, you'll learn how to calculate the P-value in Excel, which is essential for statistical analysis. Calculating P-value helps to determine the significance of your findings, which is pivotal in research across various fields.
Understanding P-Value
The P-value or probability value is a statistical measure that tells us whether the results obtained from a study are statistically significant or if they could have occurred by chance. Here’s what you need to know:
- Null Hypothesis (H0): The assumption that there is no effect or no difference.
- Alternative Hypothesis (H1): The hypothesis you’re trying to prove, where an effect or difference exists.
- P-value helps to decide whether to reject the null hypothesis. A lower P-value indicates stronger evidence against H0.
Steps to Calculate P-Value in Excel
1. Prepare Your Data
Ensure your data is organized into separate columns:
- The first column contains the sample data or the treatment group data.
- If comparing two groups, use another column for the control group.

2. Select the Appropriate Statistical Test
Based on your research, choose the correct statistical test:
- T-Test: For comparing means between two groups.
- ANOVA: For comparing means across three or more groups.
- Chi-Square Test: For categorical data analysis.
- Regression Analysis: For modeling relationships between variables.
3. Calculating P-Value with T-Test
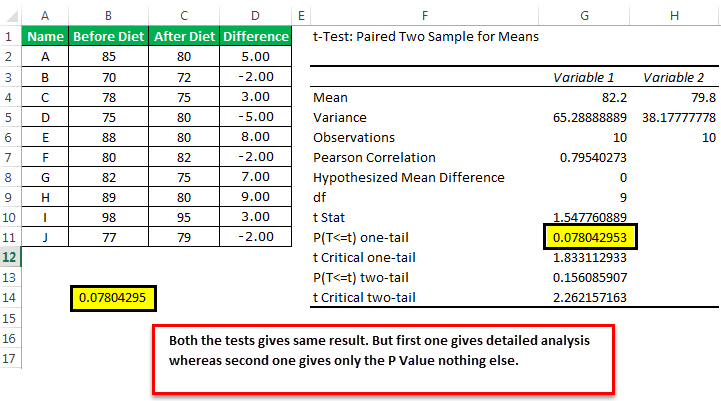
Use the following steps to perform a t-test:
- Select an empty cell where you want the P-value to appear.
- Enter the formula:
=T.TEST(array1, array2, tails, type) - array1: The range of cells containing the first dataset.
- array2: The range of cells containing the second dataset.
- tails: 1 for one-tailed test or 2 for two-tailed test.
- type: 1 for paired, 2 for two-sample unequal variance, and 3 for two-sample equal variance.
📌 Note: Ensure you choose the right type of t-test based on your sample data characteristics.
4. Interpreting the P-Value
Here’s how to interpret the P-value:
- If P-value is less than or equal to the significance level (usually 0.05 or 5%), reject the null hypothesis.
- A P-value greater than 0.05 suggests insufficient evidence to reject H0.

| P-Value | Interpretation |
|---|---|
| ≤ 0.05 | Significant result. Reject H0. |
| > 0.05 | Insignificant result. Do not reject H0. |
5. Common Pitfalls
Avoid these common mistakes:
- Sample Size: A small sample size can lead to unreliable P-values.
- Multiple Comparisons: Performing multiple tests can increase the chance of Type I errors.
- Data Quality: Ensure data is free from significant errors or outliers.
📊 Note: Consider using data visualization techniques to complement your P-value analysis for better understanding.
By now, you've learned how to calculate the P-value using Excel and interpret its significance. Remember, the P-value is just one part of the puzzle in statistical analysis. Integrating this knowledge with other statistical measures and good research practices can lead to more robust conclusions.
What is a P-value?
+The P-value is a measure used in hypothesis testing to help you determine the strength of the evidence against the null hypothesis.
Can P-value be greater than 1?
+No, the P-value is always between 0 and 1. A P-value of 1 indicates that the observed data perfectly matches the null hypothesis, while a value close to 0 suggests strong evidence against it.
What does a P-value of 0.05 mean?
+A P-value of 0.05 means there is a 5% chance of observing the data (or something more extreme) if the null hypothesis were true. This is often used as a cutoff for statistical significance.
Related Terms:
- Pvalue Excel
- P-value Excel formula
- Kalkulator p-value
- P value Correlation in Excel
- Statistical significance calculator Excel
- calculate p value using excel


