Mastering Excel Reports: Your Step-by-Step Guide

Introduction to Excel Reporting
In the realm of data analysis and management, Microsoft Excel stands as a titan, offering robust tools for organizing, analyzing, and reporting data. Reports generated in Excel are critical for businesses, researchers, and individuals looking to make informed decisions based on data-driven insights. Whether you're compiling financial statements, analyzing sales data, or tracking project progress, Excel provides a platform where you can effortlessly customize and present your findings in a visually appealing and comprehensible manner.

Setting Up Your Excel Workbook
Before diving into the intricacies of report creation, setting up your workbook correctly is foundational. Here’s how:
- Open Excel and create a new workbook or open an existing one.
- Plan your structure:
- Decide which data sets are crucial for your report.
- Label sheets appropriately (e.g., Data, Raw, Analysis, Report).
- Organize data:
- Input raw data into designated sheets, ensuring consistency in format.
- Save Your Work: Regularly save your workbook to prevent data loss.
Key Components of an Excel Report
An effective Excel report incorporates several key elements:
- Executive Summary: A brief overview of findings.
- Data Source: Where and how the data was obtained.
- Methodology: How data analysis was performed.
- Findings and Analysis: Detailed analysis with visuals.
- Conclusion: Key takeaways and next steps.
- Supporting Documentation: References or charts for deeper context.
Creating a Simple Table
Let's illustrate with an example of how to create a basic table:

| Month | Sales | Profit |
|---|---|---|
| January | 15000 | 3000 |
| February | 18000 | 4500 |
| March | 16000 | 3500 |
📊 Note: Keep your data clean; format dates uniformly and avoid unnecessary merge cells which can complicate data manipulation.
Advanced Excel Techniques for Better Reporting
Data Validation
- Implement data validation rules to ensure data entry accuracy.
Conditional Formatting
- Use conditional formatting to highlight critical data points.
Pivot Tables
- Summarize and analyze large datasets with ease.
Charts and Graphs
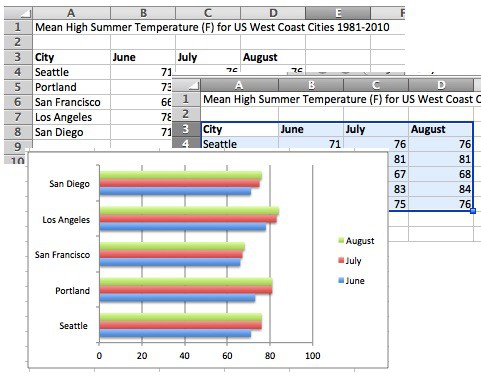
- Create dynamic charts to visually represent data trends.
Automating Reports with Macros
Macros can significantly speed up the report generation process:
- Learn to record simple macros for repetitive tasks.
- Use Visual Basic for Applications (VBA) for more complex automation.
Sharing and Collaborating on Reports
Collaborative work in Excel can be streamlined:
- Enable editing by multiple users through shared workbooks or OneDrive.
- Use Excel Online for real-time collaboration.
- Protect sensitive data with passwords or permissions.
Tips for an Impressive Report Presentation
- Ensure your report is visually coherent with consistent styles.
- Place headers and footers for branding and page navigation.
- Include executive summaries at the beginning and conclusions at the end.
- Use themes for professional aesthetics.
Summarizing our journey through Excel report mastery, the key to creating comprehensive and insightful reports lies in understanding and utilizing Excel's diverse functionalities. From structuring your workbook to employing advanced techniques like data validation, pivot tables, and macros, each step is crucial in elevating your reports from basic data dumps to professional-grade insights.
Why should I use Excel for reporting?
+Excel offers a versatile platform for data manipulation, analysis, and presentation. Its widespread use in businesses means that your reports will be easily accessible and interpretable by a wide audience.
How can I make my Excel reports visually appealing?
+Use Excel’s built-in themes, format cells for color consistency, incorporate charts, and utilize conditional formatting to highlight significant data. Also, ensure alignment, font sizes, and color schemes are consistent throughout.
Can I automate Excel reports?
+Yes, with macros or VBA scripts, you can automate repetitive tasks, data updates, and report generation, saving time and reducing human error.
What are some common mistakes to avoid in Excel reporting?
+Avoid issues like:
- Incorrect range selection when creating formulas or charts.
- Neglecting data validation, leading to inaccurate entries.
- Overcomplicating reports with too many features, which can confuse viewers.
How can I share my Excel report securely?
+Use OneDrive or SharePoint for sharing with specific access permissions. You can also password protect your workbook to secure sensitive data.
Related Terms:
- how to write excel reports
- Related searches excel reporting tutorial


