5 Easy Steps to Find P-Value in Excel

Calculating the p-value is a crucial step in statistical analysis, especially when you're testing hypotheses. Whether you're a researcher, student, or data analyst, understanding how to find the p-value in Microsoft Excel can make your work much more efficient. Excel, while known primarily as a spreadsheet tool, offers statistical functions that can simplify complex calculations. Here's how to find the p-value in Excel using five easy steps.
Step 1: Input Your Data

Before you can perform any statistical tests, you’ll need to have your data ready in Excel. Here’s how to set it up:
- Open a new or existing Excel worksheet.
- Enter your experimental data into columns or rows. For instance, if you have two groups to compare, you might use two columns:
- Use separate columns for different variables if needed, like before and after data points.

| Group A | Group B |
|---|---|
| Data point A1 | Data point B1 |
| Data point A2 | Data point B2 |
| … | … |
📝 Note: Ensure your data is organized logically and that there are no errors or blank cells in your data range.
Step 2: Calculate Test Statistics

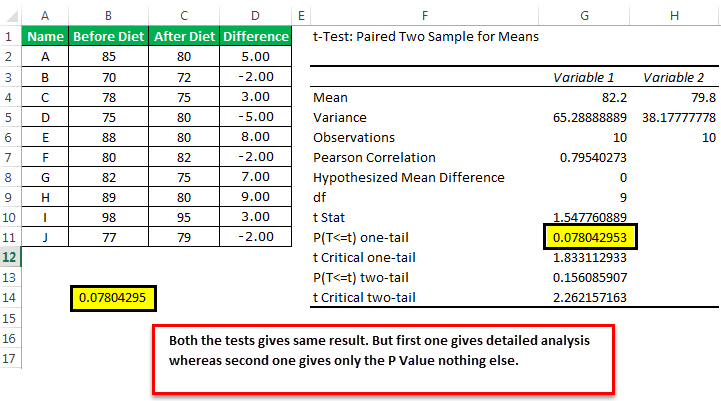
Excel offers various statistical tests. For this example, we’ll focus on a common one: the t-test for comparing means. Here’s how to perform a t-test:
- Select an empty cell where you want to display the result.
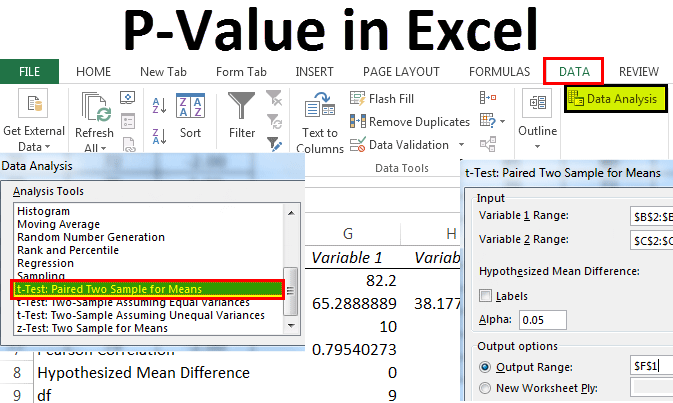
- Use the t-Test: Two-Sample Assuming Equal Variances or t-Test: Two-Sample Assuming Unequal Variances tool from the Data Analysis add-in if available:
- Go to Data > Data Analysis > t-Test (select your type of t-test).
- Enter the range of data for both groups.
- Click OK and Excel will provide statistics including the p-value.
- If you don’t have the Data Analysis tool, you can manually calculate the t-statistic and then use Excel’s T.DIST.2T or T.DIST.RT function to find the p-value:
- Calculate mean, variance, and sample size for each group.
- Use these values to compute the t-statistic manually or with a formula.
- Apply
=T.DIST.2T(t-statistic,degrees_of_freedom)or=T.DIST.RT(t-statistic,degrees_of_freedom)for one-sided tests.
Step 3: Interpret the P-Value
After obtaining the p-value, interpreting it is key to drawing conclusions from your data:
- The p-value represents the probability of obtaining test results at least as extreme as the observed results, assuming the null hypothesis is true.
- If the p-value is less than your significance level (commonly set at 0.05), you reject the null hypothesis.
- A small p-value (less than 0.05) suggests strong evidence against the null hypothesis, suggesting that your result is unlikely due to chance.
Step 4: Record Your Findings
Documenting your findings not only helps with reporting but also in planning future experiments or analyses:
- Create a summary table that includes:
- Save this table or print it for future reference or reporting purposes.
- Consider including graphical representations like histograms or box plots alongside the p-value results to visualize data distribution and differences between groups.
| Test Used | P-Value | Conclusion |
|---|---|---|
| T-Test | 0.0145 | Reject null hypothesis |
📌 Note: Accurate recording helps in verifying the results later and ensures transparency in your analysis process.
Step 5: Advanced Analysis and Reporting

Excel can be utilized for more advanced statistical analysis and reporting:
- Use descriptive statistics to summarize your data (under Data Analysis tool).
- Create confidence intervals to estimate the population parameter.
- Perform ANOVA (Analysis of Variance) if you have more than two groups to compare.
- Consider integrating Excel with other statistical software like R or Python for more complex analyses or when dealing with large datasets.
- Use pivot tables and charts for effective data visualization and reporting.
By following these five steps, you can harness Excel's capabilities for statistical analysis, particularly in finding the p-value, which is a cornerstone in hypothesis testing. This not only simplifies your workflow but also enhances your ability to make data-driven decisions or contribute to scientific research with confidence. The ease with which you can perform these analyses in Excel makes it a powerful tool for both novice and experienced analysts alike. So next time you're faced with the need to find a p-value, remember these steps to streamline your analysis process, ensuring you're equipped to tackle statistical challenges efficiently.
Why is it important to calculate the p-value in Excel?
+Calculating the p-value in Excel allows researchers, scientists, and data analysts to assess the significance of their findings, helping to reject or fail to reject null hypotheses in a variety of statistical tests.
What if my p-value is greater than 0.05?
+If your p-value is greater than the common significance level of 0.05, you fail to reject the null hypothesis, indicating that the observed effect could have occurred by chance, and there’s insufficient evidence to support the alternative hypothesis.
Can Excel handle multiple comparison adjustments like Bonferroni or Holm?
+Excel can perform basic statistical tests, but for more advanced adjustments like Bonferroni or Holm, external tools or manual calculations are necessary.
What types of t-tests can I perform in Excel?
+Excel supports t-tests for Two-Sample Assuming Equal Variances, Two-Sample Assuming Unequal Variances, Paired, and One-Sample tests.
Related Terms:
- P value Excel
- P-value Excel formula
- Kalkulator p-value
- P value Correlation in Excel
- T table
- Mencari nilai p value


