5 Easy Excel Tips to Calculate Percentage Differences

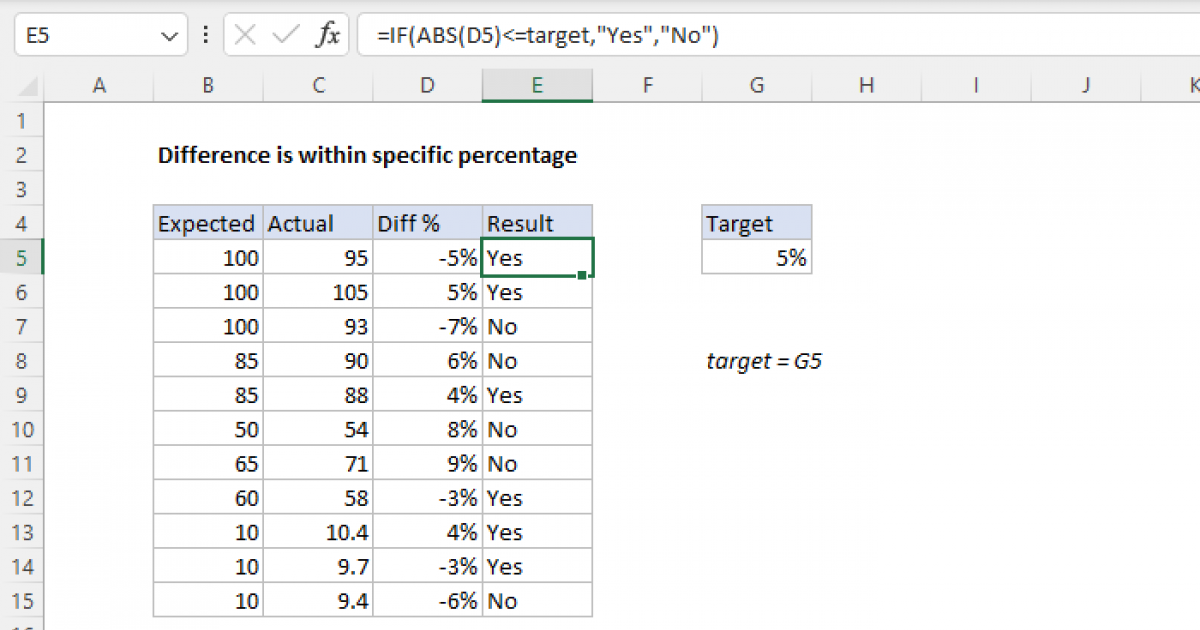
Calculating percentage differences in Microsoft Excel can often be a straightforward task, but there are nuances and advanced techniques that can streamline your workflow, enhance accuracy, and give you a more professional touch. Whether you're dealing with financial reports, performance metrics, or any data-driven analysis, understanding how to calculate percentages effectively is key. Here are five easy Excel tips to calculate percentage differences that will take your data manipulation skills to the next level:
1. Basic Percentage Increase or Decrease
The simplest way to calculate the percentage difference between two numbers is by determining the percentage increase or decrease.
- Formula: `=((New Value - Original Value) / Original Value) * 100`
- Example: If your sales went from 100 to 120 in a month, the formula in Excel would be `=((B2-A2)/A2)*100` where A2 and B2 are the respective cells with your original and new value.
📝 Note: Ensure your cells are formatted to display percentages to get a readable output.
2. Handling Zero Values
Zero values can create issues because dividing by zero is undefined in mathematics. Here's how to manage them:
- Formula with Zero Handling: Use `=IF(Original Value = 0, IF(New Value = 0, 0, "Error"), ((New Value - Original Value) / Original Value) * 100)`
- This formula checks if the original value is zero, and if so, it returns 0 if both values are zero or an error message for any other case.
3. Using Conditional Formatting
To make your data visually appealing and to instantly recognize trends:
- Select the cells with your percentage differences.
- Go to "Home" > "Conditional Formatting" > "New Rule."
- Choose "Format only cells that contain."
- Select "Cell Value" > "greater than" > "0" for positive changes. You can choose a color for upward trends.
- Repeat for negative changes, selecting "less than" and choosing another color.
4. Data Validation for Consistency
To ensure consistency in how percentage changes are reported:
- Select the cells where users will input data.
- Go to "Data" > "Data Validation."
- Under "Allow," choose "Custom."
- In the "Formula" box, enter `=ISNUMBER(A2)*(A2>=0)*(A2<=100)` to enforce that entries are numeric, non-negative, and within 100%.
5. Using Vlookup with Percentage Differences
When you're looking at large datasets, combining VLOOKUP with percentage differences can be powerful:
- Formula: `=VLOOKUP(Reference, Data Range, Column Index, [Approximate Match])*Percentage Difference Formula`
- This technique allows you to fetch data from a table based on a reference and then apply the percentage difference.

| Year | Original Value | New Value | Percentage Difference |
|---|---|---|---|
| 2020 | 100 | 120 | =((C2-B2)/B2)*100 |
| 2021 | 120 | 150 | =((C3-B3)/B3)*100 |
| 2022 | 150 | 145 | =((C4-B4)/B4)*100 |
📝 Note: Ensure all referenced cells in formulas correspond to the correct rows in your table.
In wrapping up this exploration of Excel's percentage calculation capabilities, we've covered essential techniques that enhance your data analysis and presentation skills. From basic formulas to advanced data validation, these tips provide a framework for calculating percentage differences efficiently and accurately. Implementing conditional formatting not only makes your spreadsheets more visually appealing but also instantly conveys trends, allowing for quick decision-making.
Moreover, combining these methods with functions like VLOOKUP can unlock even more insights from your data. This approach not only simplifies your work but also ensures consistency and clarity in reporting, fostering trust in your data handling abilities.
Remember, Excel is a tool of great potential, and mastering even these simple techniques can significantly boost your efficiency and effectiveness in data analysis. Keep practicing these skills, and you'll find that your confidence with Excel grows, along with your capacity to derive valuable insights from your data.
Why is calculating percentage differences important in Excel?
+Calculating percentage differences in Excel allows you to assess changes or growth over time, compare performance metrics, and make data-driven decisions effectively.
What’s the easiest way to format percentages in Excel?
+Highlight the cells, then right-click, select “Format Cells,” choose “Percentage” from the Category list, and set the desired number of decimal places.
How do you handle negative percentage differences?
+The formula will naturally produce negative results when the new value is less than the original value. Ensure your cells are formatted to show negatives, typically with parentheses or a minus sign.
Can you calculate percentage change between multiple cells?
+Yes, by dragging the formula down or across cells, you can apply the percentage difference calculation to multiple values at once.
Is it possible to automate percentage change calculations with Excel?
+Absolutely, by using Excel’s macros or VBA (Visual Basic for Applications), you can automate complex tasks including percentage change calculations with customized logic.
Related Terms:
- Format percentage Excel
- Excel minus percentage
- Excel formula list
- average percent difference in excel
- relative difference formula excel
- calculate difference formula excel


