-

5 Easy Steps for Percentage Increase in Excel
Learn how to easily calculate and understand percentage increases in Excel with this step-by-step guide.
Read More » -

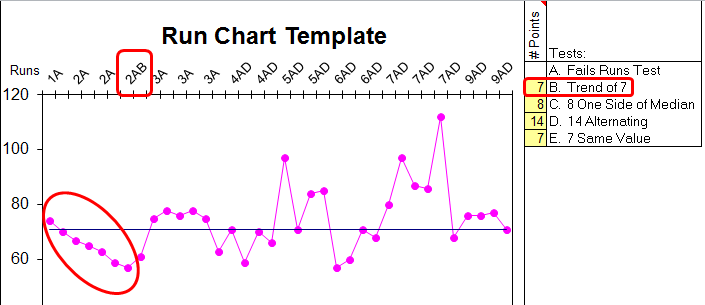
Create a Simple Run Chart in Excel Easily
Learn the steps to create and customize a run chart in Excel for tracking performance metrics over time.
Read More » -

Creating Box Plots in Excel: Easy Guide
Learn how to visually represent data distributions using Excel's box and whisker plot tool. This guide offers step-by-step instructions on creating, customizing, and interpreting box plots for better data analysis.
Read More » -

Excel Percent Change Formula in Simple Steps
Learn the step-by-step process to calculate percent change in Microsoft Excel with practical examples.
Read More »