Master Hypothesis Testing in Excel with Ease

Excel is more than just a tool for data tabulation or basic calculations; it's a powerful software for statistical analysis, including hypothesis testing. Whether you're a student, a researcher, or a professional in any field requiring data analysis, mastering hypothesis testing in Excel can give you a significant advantage. This comprehensive guide will walk you through the intricacies of conducting hypothesis testing in Excel, ensuring you can apply these techniques confidently and accurately.
Understanding Hypothesis Testing
Hypothesis testing is a fundamental aspect of statistical analysis where we make inferences about populations based on sample data. Here’s a brief overview:
- Null Hypothesis (H0): The statement being tested, typically assumes no effect or no difference.
- Alternative Hypothesis (H1 or Ha): This contrasts the null hypothesis, often suggesting the presence of an effect or difference.
- Test Statistic: A value calculated from the sample data to test the null hypothesis.
- P-value: The probability of obtaining test results at least as extreme as the observed results, assuming the null hypothesis is true.
- Decision Rule: Based on the p-value, you decide whether to reject or fail to reject the null hypothesis.
Excel Tools for Hypothesis Testing
Excel provides several tools for statistical analysis:
- Data Analysis ToolPak: An add-in for performing a wide range of statistical analyses.
- Functions like T.Test, Z.Test: For specific tests like t-tests, z-tests, etc.
- Chi-square Test: Available through the toolpak for categorical data analysis.

Step-by-Step Guide to Hypothesis Testing in Excel
Enable the Data Analysis ToolPak
Before diving into hypothesis testing, ensure the Data Analysis ToolPak is enabled:
- Go to “File” > “Options” > “Add-ins.”
- At the bottom, select “Excel Add-ins” from the “Manage” dropdown.
- Click “Go.”
- Check the box next to “Analysis ToolPak.”
- Click “OK.”
🔍 Note: If you don’t see the Analysis ToolPak in the list, you might need to install it from your Office installation package.
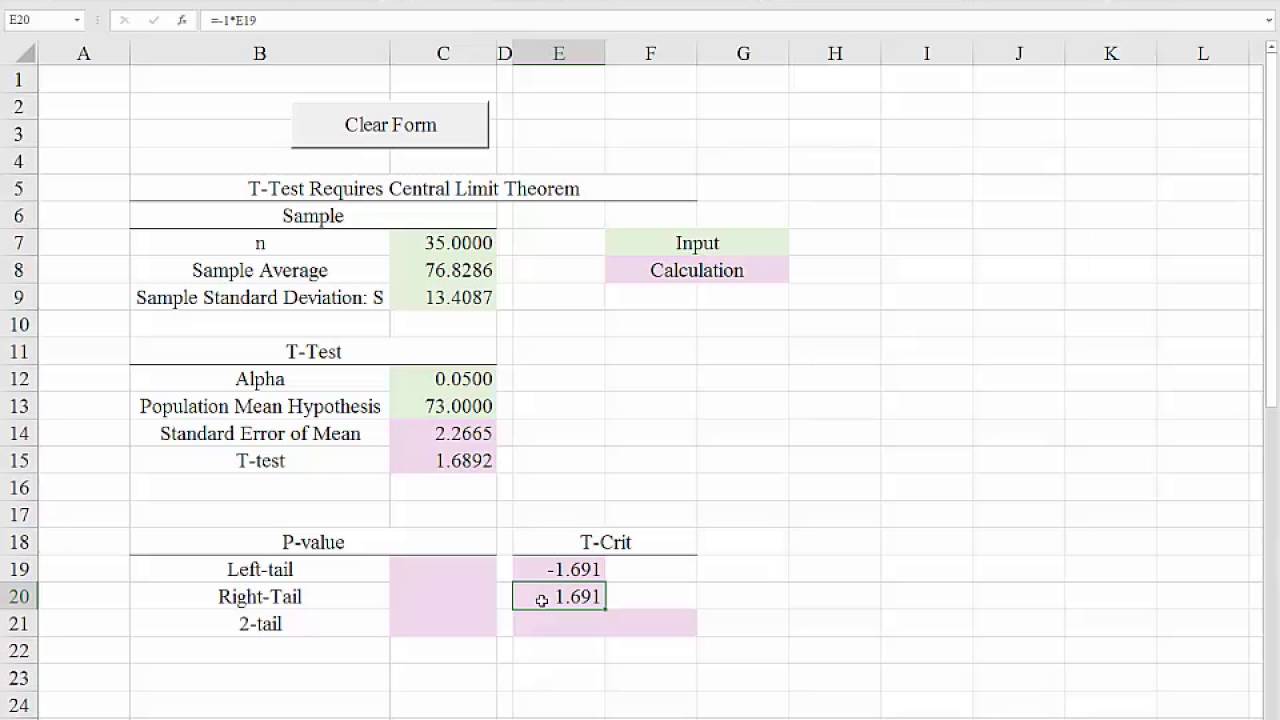
Conducting a t-Test
Here’s how you can perform a one-sample t-test:
- Select “Data” tab > “Data Analysis.”
- Choose “t-Test: Two-Sample Assuming Equal Variances” or “t-Test: Paired Two Sample for Means.”
- Input your data ranges, specify the hypothesized mean difference if applicable, and choose your alpha level.
- Click “OK” to see the results.

| Input | Description |
|---|---|
| Variable 1 Range | Select the range of data for the first group. |
| Variable 2 Range | Select the range of data for the second group. |
| Hypothesized Mean Difference | Enter the expected mean difference, often zero for no difference. |
| Alpha | Set your significance level, typically 0.05. |
⚠️ Note: Be cautious when choosing the type of t-test as misclassification can lead to incorrect results.
Interpreting the Results
The output from the t-test will include:
- t Stat: The test statistic value.
- P(T<=t) one-tail: The one-tailed p-value.
- P(T<=t) two-tail: The two-tailed p-value.
- Critical value: The threshold value for rejecting the null hypothesis.
- Decision: If your p-value is less than or equal to your alpha level, you reject the null hypothesis.
Advanced Hypothesis Testing Techniques
ANOVA
Analysis of Variance (ANOVA) allows you to compare means among more than two groups:
- Go to “Data” tab > “Data Analysis.”
- Choose “ANOVA: Single Factor” or “ANOVA: Two-Factor With Replication” depending on your design.
- Select your data ranges and input levels.
- Run the analysis.
📌 Note: ANOVA is more robust for analyzing the variance within and between groups.
Chi-Square Test
This test is used for categorical data:
- Navigate to “Data” > “Data Analysis.”
- Select “Chi-square Test: Two-Sample for Variances.”
- Input your data ranges and run the test.
📝 Note: Ensure your data is in a contingency table format for chi-square testing.
Wrapping Up
Excel provides an accessible platform for conducting hypothesis tests, from simple t-tests to more complex ANOVA analyses. By understanding these techniques, you can make informed decisions based on data, draw valid conclusions, and refine your research or business strategies. Remember to always check the assumptions underlying each test, properly interpret your results, and consider the limitations of your study. With practice, hypothesis testing in Excel will become second nature, allowing you to unlock insights from your data with precision.
What is the difference between a one-tailed and a two-tailed t-test?
+In a one-tailed t-test, you are only interested in whether the effect is in one direction, like testing if a new treatment increases or decreases a variable. Conversely, a two-tailed t-test checks for an effect in either direction, looking for any significant difference from the null hypothesis.
How do I know which hypothesis test to use?
+Your choice depends on several factors:
- Type of data (continuous, categorical)
- Number of groups (t-test for two, ANOVA for more)
- Your research question (difference in means, proportions, etc.)
- Assumptions about your data distribution
Can I perform non-parametric tests in Excel?
+Excel does not have built-in functions for non-parametric tests like the Mann-Whitney U test or Kruskal-Wallis test. However, you can use formulas or third-party add-ins to perform these tests.
How do I handle missing data in Excel before running a hypothesis test?
+You should either remove the missing values or use techniques like imputation to fill in the gaps. Removing or imputing can affect your analysis results, so consider this impact carefully.
What does it mean when I “fail to reject the null hypothesis”?
+This indicates that based on your sample data, there isn’t sufficient evidence to conclude that the null hypothesis is false. It doesn’t prove the null hypothesis is true; it simply means you lack evidence to reject it.
Related Terms:
- Hypothesis Testing Excel two samples
- Hypothesis testing in Excel PDF
- what is hypothesis testing
- hypothesis testing spreadsheet


