5 Simple Steps to Anova Analysis in Excel

ANOVA, or Analysis of Variance, is a statistical method that stands as a cornerstone for comparing group means within a data set. Whether you're in the realm of science, psychology, or even marketing, understanding ANOVA can be pivotal for making data-driven decisions. Excel, a software synonymous with data analysis, provides a user-friendly environment to perform ANOVA. Here are five simple steps to get you started on conducting ANOVA analysis in Excel:
Step 1: Organizing Your Data
The foundation of any statistical analysis is well-organized data. Here’s how you can structure your data for an ANOVA test in Excel:
- Label Columns Clearly: Ensure each column has a descriptive title, reflecting the variable or group you’re analyzing.
- Ensure Uniformity: Data should be entered uniformly, ensuring no extraneous characters, and all numerical entries are in the same format.
- Check for Missing Values: Missing data can disrupt ANOVA. Either replace or remove missing values appropriately.
Step 2: Selecting the ANOVA Test
Excel supports multiple ANOVA tests:
- One-Way ANOVA: Use this when comparing means across three or more groups based on one factor.
- Two-Way ANOVA: Ideal for two independent variables affecting an outcome.
- ANOVA with Replication: Use when data includes multiple measurements per group or condition.
- ANOVA without Replication: For data with only one measurement per group.
To access ANOVA tools, navigate to:
Data > Data Analysis (If not visible, load the Analysis ToolPak add-in from Excel Options > Add-Ins > Go)
Step 3: Running the ANOVA Test
After selecting the appropriate test:
- Input Range: Define where your data is.
- Output Options: Choose to display results in a new worksheet or within the existing one.
- Alpha: Set the significance level, typically at 0.05.
Step 4: Interpreting Your ANOVA Results
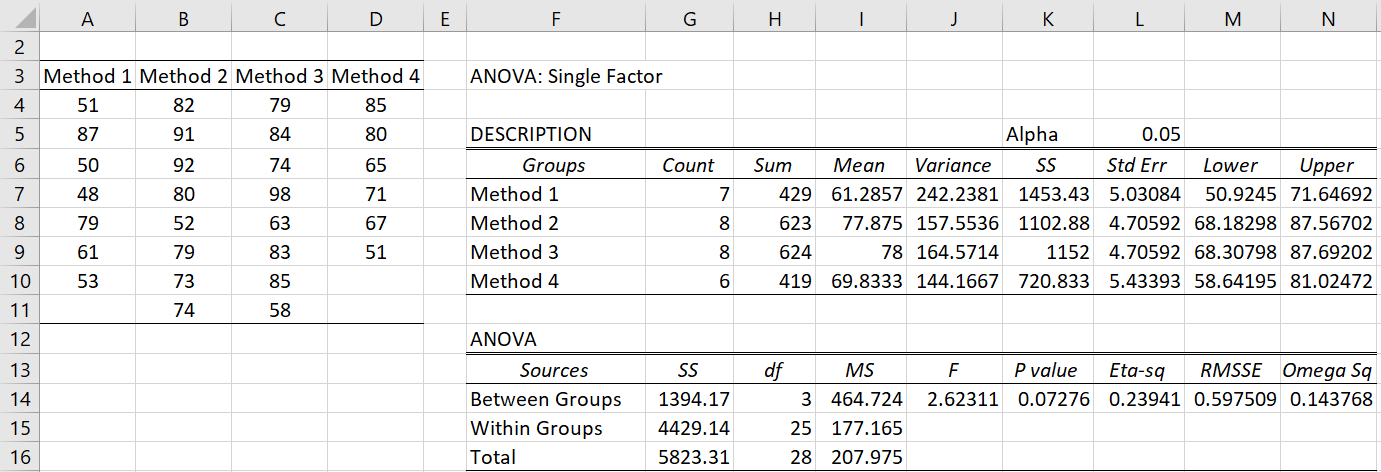
ANOVA results come with:
- F-Statistic: The ratio of between-group variability to within-group variability.
- P-Value: Indicates the statistical significance. If less than your alpha, reject the null hypothesis.
- F-Critical Value: If your F-statistic is greater than this, you can reject the null hypothesis.
Remember, ANOVA only tells you if there's a difference; you'll need further tests like Tukey's HSD to pinpoint where those differences lie.
Step 5: Post Hoc Analysis
ANOVA suggests that differences exist, but doesn’t tell where. Use:
- Tukey’s HSD: For post hoc testing of one-way ANOVA.
- Bonferroni Correction: Adjusts p-values for multiple comparisons.
✅ Note: If you encounter an error message, ensure your data is correctly structured, and no cells are merged in your selection.
In this journey through ANOVA in Excel, you've learned to organize data, choose the correct test, execute it, interpret the results, and even delve into post hoc analyses. This method not only helps in comparing means across groups but also aids in uncovering underlying patterns in your data. Applying ANOVA can lead to insights in various fields, enhancing the decision-making process with empirical evidence.
What if my data isn’t normally distributed?
+
ANOVA assumes normality, but it’s robust to minor deviations. For severely non-normal data, consider non-parametric tests like Kruskal-Wallis.
Can I do ANOVA with unequal sample sizes?
+
Yes, ANOVA can handle unequal sample sizes, though it’s more robust with balanced data.
How can I test for homogeneity of variances?
+
Use Levene’s Test or Bartlett’s Test in Excel to check for equal variances among groups.
What if my ANOVA results show a significant interaction?
+
Further investigation is required. Consider simple effects analysis or run specific contrasts to understand the interaction effect.
Can ANOVA be performed on nominal data?
+
No, ANOVA assumes continuous data. Use Chi-square or other categorical data analysis techniques for nominal data.
Related Terms:
- Download ANOVA for Excel
- ANOVA Calculator
- ANOVA single factor
- Excel Easy
- Post hoc Analysis in Excel
- Two-way ANOVA in Excel


