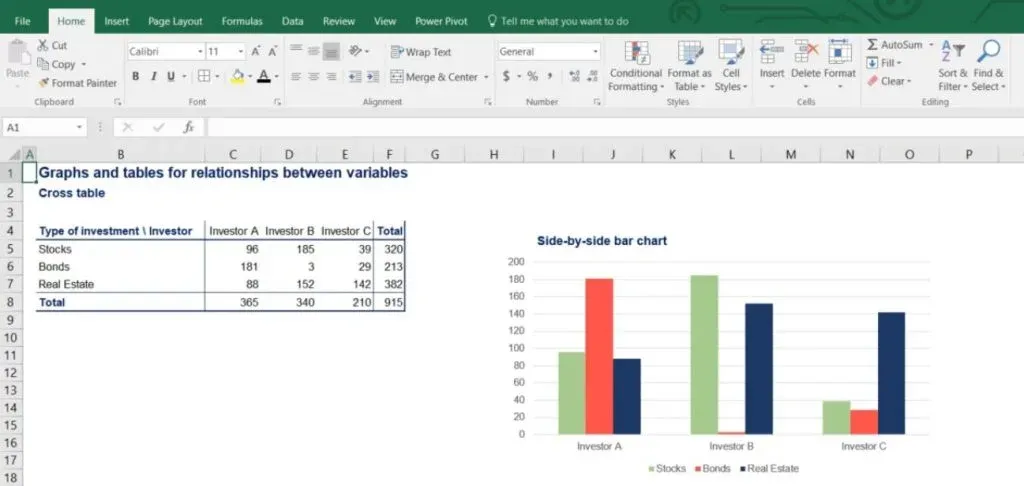
5 Simple Steps to Create a Contingency Table in Excel

Ever found yourself in a position where you need to analyze categorical data to understand the relationship between two variables? If your answer is yes, you've come to the right place. Contingency tables, also known as cross-tabulation, are a fundamental tool in statistics for summarizing and presenting categorical data, providing insights into how often different categories occur together. In this comprehensive guide, we'll explore the practical steps to create a contingency table in Microsoft Excel, turning raw data into actionable insights.
Step 1: Prepare Your Data
The first step is to organize your data in a spreadsheet format. Here's what you need to do:
- Ensure data is in rows: Each row should represent an individual record or observation.
- Two variables per column: You'll have one variable per column, and the values within these columns will determine the rows and columns of your contingency table.
- Check for missing values: Make sure your data is clean and there are no missing entries that could skew your analysis.
Step 2: Identify the Categories
Before jumping into creating the table, identify the categories for each variable:
- List categories for Variable A: This could be different responses to a survey question or different classifications.
- List categories for Variable B: Ensure you capture all the possible categories to avoid missing data points.
Step 3: Use the PivotTable Feature
Excel's PivotTable feature is a powerful tool for creating contingency tables. Here's how to use it:
- Select your data range: Click and drag to select the data you want to include in the analysis.
- Go to Insert > PivotTable: Choose whether you want the PivotTable to appear in the same sheet or a new one.
- Drag and drop: Drag one variable to the Row Labels area, the other to the Column Labels, and the same variable to the Values area. This creates the cross-tabulation with counts of the frequency of each category combination.

| Category A | Category B | Counts |
|---|---|---|
| Category 1 | Category X | 15 |
| Category 1 | Category Y | 12 |
| Category 2 | Category X | 10 |
| Category 2 | Category Y | 20 |
🎯 Note: When using PivotTables for contingency tables, ensure that the 'Summarize values by' option is set to 'Count' for categorical data.
Step 4: Format Your Table
Excel's built-in tools can help you make your contingency table visually appealing and easy to interpret:
- Add totals: Include row and column totals to give an overview of the frequency distribution.
- Apply table styles: Use Excel's built-in table styles for better readability.
- Conditional formatting: Highlight cells with specific colors or data bars to quickly identify trends or outliers.
Step 5: Analyze and Interpret
With your contingency table ready, it's time to analyze the results:
- Assess Independence: Use the Chi-square test of independence to determine if there's a significant relationship between the variables.
- Calculate Percentages: Add percentage columns or rows to understand proportions within the table.
- Identify Patterns: Look for patterns or anomalies within the data that could lead to further investigations or insights.
By following these steps, you've not only created a contingency table in Excel but also set the stage for deeper data analysis. From here, you can proceed to interpret your findings or perhaps delve into more advanced statistical analyses if needed. Remember, the key is to let the data guide your analysis, providing clarity and actionable insights into the variables at play.
What is the purpose of a contingency table?
+A contingency table helps analyze and understand the relationship between two categorical variables by showing how often different categories occur together.
Can I create a contingency table without the PivotTable feature?
+Yes, you can create a contingency table manually using Excel formulas like COUNTIF or manually tallying, though it might be less efficient for larger datasets.
How do I perform a Chi-square test in Excel?
+Excel does not have a built-in Chi-square test function. However, you can perform the test manually by calculating expected frequencies and using the CHISQ.TEST function.
Can I use a contingency table for more than two variables?
+Yes, you can extend a contingency table to include more variables by adding dimensions, though it can become complex and harder to visualize as dimensions increase.
What if my data is not categorical?
+If your data is not categorical, you might need to categorize it first or use different statistical tools better suited for continuous data analysis.
Related Terms:
- Contingency table Maker
- construct a contingency table
- create contingency table in excel
- 2x2 contingency table excel
- how to calculate contingency table
- 2x2 contingency table in r


