Anova Test on Excel: Simple Guide and Tutorial

The Analysis of Variance (ANOVA) test is a critical tool in statistical analysis, particularly useful when comparing means among more than two groups. This blog post provides a comprehensive, simple guide on how to perform an ANOVA test using Microsoft Excel, aimed at both beginners and those looking to refine their data analysis skills.
What is ANOVA?
ANOVA, or Analysis of Variance, is a statistical technique used to compare the means of three or more samples to see if they come from populations with the same mean. It essentially checks:
- Whether the means of several groups differ significantly from each other
- The variability within groups versus the variability between groups
When to Use ANOVA
ANOVA is ideal when:
- You have three or more groups to compare.
- The dependent variable is continuous, and the independent variable is categorical.
- The samples are independent of each other, and normally distributed.
- There’s homogeneity of variances across the groups.
Steps to Perform ANOVA in Excel
Here’s a detailed walkthrough on how to perform an ANOVA test using Excel:
Step 1: Prepare Your Data
Ensure your data is structured correctly:
- Each group should be in a separate column or row.
- Include headers for each group.
Step 2: Load the Analysis ToolPak
Excel’s Analysis ToolPak needs to be activated:
- Go to File > Options > Add-Ins.
- Select Analysis ToolPak and click Go.
- Check the box next to Analysis ToolPak, then OK.
Step 3: Running the ANOVA Test
After preparing your data:
- Go to Data > Data Analysis (if you don’t see it, repeat Step 2).
- Choose Anova: Single Factor.
- Select your data range in the Input Range box.
- Ensure Labels in First Row is checked if your data includes headers.
- Set the Alpha level (commonly 0.05 for 95% confidence).
- Choose where to output the results (new worksheet or existing range).
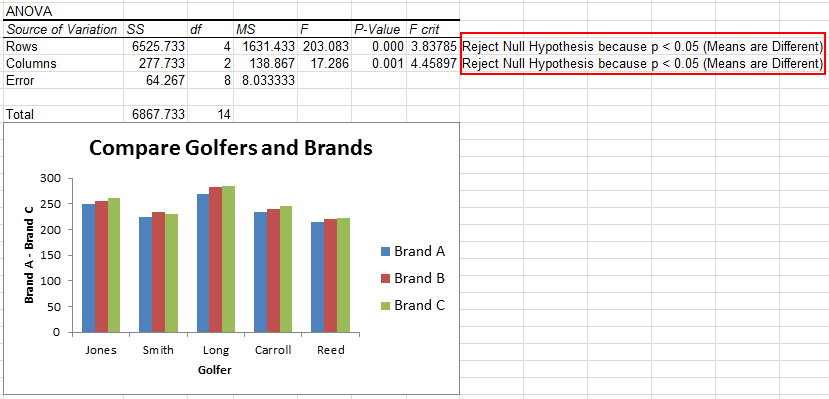
Step 4: Interpreting Results
Your ANOVA results will be presented in several columns:

| Source of Variation | SS | df | MS | F | P-value | F crit |
|---|---|---|---|---|---|---|
| Between Groups | Sum of Squares | Degrees of Freedom | Mean Square | F statistic | P-value | Critical F value |
| Within Groups | Sum of Squares | Degrees of Freedom | Mean Square | — | — | — |
| Total | Total Sum of Squares | Total Degrees of Freedom | — | — | — | — |
Interpreting the Results:
- If the F statistic is greater than F crit, or the P-value is less than your chosen Alpha, then the differences between group means are statistically significant.
📌 Note: P-values less than the chosen significance level (usually 0.05) indicate significant differences among groups.
Step 5: Post Hoc Tests
If your ANOVA shows significant results:
- Excel does not offer a built-in feature for post hoc analysis. However, you can perform additional testing like the Tukey’s HSD test manually or use another statistical tool.
📌 Note: Use external tools or functions like the TukeyHSD function from R for post hoc tests when Excel doesn't suffice.
Considerations for Advanced ANOVA
For two-way ANOVA or repeated measures:
- Excel’s capability is somewhat limited. Consider using specialized statistical software like SPSS or R for complex ANOVA procedures.
In summary, Excel provides a straightforward way to perform a basic ANOVA, especially useful for those new to statistical analysis. By following these steps, users can analyze the variance among group means efficiently. Although it might not offer all the sophisticated features of dedicated statistical software, Excel's simplicity and accessibility make it an excellent starting point.
Can I perform a two-way ANOVA in Excel?
+Excel’s built-in tools are limited to one-way ANOVA. For two-way ANOVA or more complex analyses, external statistical software like R or SPSS is recommended.
What does a significant ANOVA result tell me?
+A significant ANOVA result indicates that at least one group mean is significantly different from the others. It does not tell which group differs, hence the need for post hoc tests.
How can I ensure my data meets ANOVA assumptions in Excel?
+Excel offers basic tools for data validation like scatter plots for normality checks and Levene’s test for homogeneity of variances. You might need external tools for more robust assessments.
Related Terms:
- Download ANOVA for Excel
- Post hoc Analysis in Excel
- Kalkulator ANOVA
- Excel for data analysis
- One-sample t-test Excel
- Rumus Anova manual


