Excel ANOVA Guide: Quick & Easy Analysis

Analyzing variance in data has never been easier with Microsoft Excel's Analysis ToolPak. Whether you're a student, researcher, or business analyst, understanding how to conduct an Analysis of Variance (ANOVA) using Excel can significantly streamline your data analysis process. In this guide, we'll walk through the steps to perform ANOVA using Excel, ensuring you can quickly grasp this statistical tool's power for comparing means across different groups.
What is ANOVA?
ANOVA, or Analysis of Variance, is a statistical method used to test the differences between group means in an experiment where the influence of categorical independent variables on one or more numeric dependent variables is to be determined. Here's how ANOVA works:
- It assesses if there are statistically significant differences among group means.
- It helps in understanding if all group means are equal or if at least one group mean differs.

Setting Up Your Data for ANOVA in Excel
Before diving into the analysis, ensure your data is properly formatted:
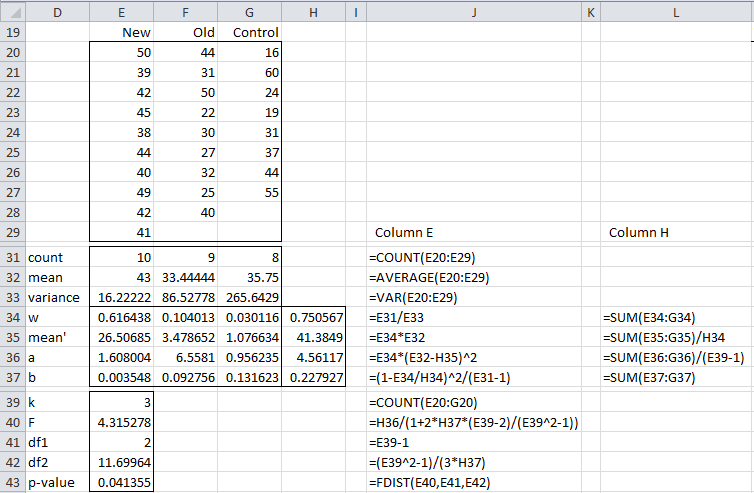
- Use Columns for Groups: Each column should represent a different group or treatment.
- Rows for Observations: Each row should contain observations for these groups.
- Ensure your data is clean, with no missing values or outliers that might skew your results.
📌 Note: For more than one dependent variable, consider using multivariate ANOVA.
Performing One-Way ANOVA in Excel
One-Way ANOVA is used when comparing means from more than two groups based on one independent variable. Here's how to execute it:
- Open Excel and ensure the Analysis ToolPak is enabled (File > Options > Add-Ins > Analysis ToolPak).
- Select the data range that includes all groups and observations.
- Navigate to Data > Data Analysis, select ANOVA: Single Factor, and click OK.
- In the dialog box:
- Input Range: Select your data range.
- Alpha: Set to 0.05 or adjust as needed for significance testing.
- Output Options: Choose where to place the output.
- Click OK to perform the analysis.
Table: ANOVA Output Overview

| Column | Description |
|---|---|
| ANOVA | Source of variation, like Between Groups or Within Groups. |
| df | Degrees of freedom. |
| SS | Sum of Squares. |
| MS | Mean Square (SS/df). |
| F | F-test statistic. |
| P-value | Probability associated with the F-statistic, used for determining significance. |
| F crit | Critical value of the F-distribution for the given significance level. |
📌 Note: If P-value > α, we fail to reject the null hypothesis, indicating no significant difference between group means.
Interpreting ANOVA Results
Understanding your ANOVA output is crucial:
- F-statistic: If the F-statistic is significant, it suggests that at least one group mean is different.
- P-value: A P-value less than or equal to your alpha level indicates significant results.
- Group Means: Look at the mean values of each group to understand where differences might lie.
Performing Two-Way ANOVA in Excel
Two-way ANOVA is for experiments with two independent variables. The process is similar, but here are the key differences:
- Use ANOVA: Two-Factor Without Replication if each group has only one observation for each combination of factors.
- Use ANOVA: Two-Factor With Replication if each group has multiple observations for each factor combination.
- Input Range, Rows per sample, and Alpha are set as before, but you specify two factor variables.

📌 Note: Post-hoc tests like Tukey's HSD can be manually performed to identify which groups differ when ANOVA results indicate a significant difference.
In the course of your analytical journey, mastering ANOVA in Excel can provide profound insights into your data. With this tool, you can confidently compare groups, understand interactions between variables, and make informed decisions. By following the steps above, you're well-equipped to leverage Excel for both one-way and two-way ANOVA, transforming raw data into actionable information. Keep in mind that practice with real datasets will further enhance your proficiency in interpreting and presenting ANOVA results.
Why use ANOVA instead of multiple t-tests?
+ANOVA is preferred over multiple t-tests for several reasons. Firstly, ANOVA controls for the increased risk of Type I errors when performing multiple pairwise comparisons. It tests the hypothesis that several means are equal, allowing for the comparison of more than two groups at once, which t-tests do not efficiently do. Additionally, ANOVA provides a holistic view of the data by analyzing variance within and between groups, offering insights that t-tests cannot provide.
Can ANOVA be used for unequal sample sizes?
+Yes, ANOVA can handle unequal sample sizes to some extent. However, it’s known as ‘unbalanced ANOVA.’ While it’s possible, care should be taken with interpretation. Robustness is ensured by adjusting degrees of freedom, but unequal sample sizes might affect power and increase the risk of Type II errors if not handled correctly.
What should I do if my ANOVA indicates a significant result?
+If your ANOVA shows a significant result, it means there is at least one difference among the means. You would then conduct post-hoc tests like Tukey’s Honestly Significant Difference (HSD) test to determine which specific groups differ from each other. This step ensures that the overall significance isn’t driven by just one or two groups.
Related Terms:
- Download ANOVA for Excel
- Post hoc Analysis in Excel
- Excel Easy
- Excel for data analysis
- Kalkulator ANOVA
- ANOVA single factor


