5 Ways to Calculate Uncertainty in Excel Easily

Excel is an incredibly powerful tool for data analysis, often used by students, researchers, and professionals alike to organize, manipulate, and visualize data. One critical aspect of data analysis, particularly in scientific and experimental contexts, is uncertainty calculation. Understanding and accurately calculating uncertainty can be pivotal in making informed decisions based on your data. This guide will walk you through five straightforward methods to calculate uncertainty in Excel, ensuring your results are not only precise but also meaningful.
Understanding Uncertainty
Before diving into the methods, let's briefly review what uncertainty means in the context of data analysis:
- Measurement Uncertainty: This refers to the doubt associated with the result of a measurement. It quantifies the accuracy and precision of the measuring process.
- Statistical Uncertainty: This is the variability inherent in a dataset due to sampling or random error, which can be quantified using statistical measures like standard deviation or confidence intervals.
1. Using the STDEV.P Function

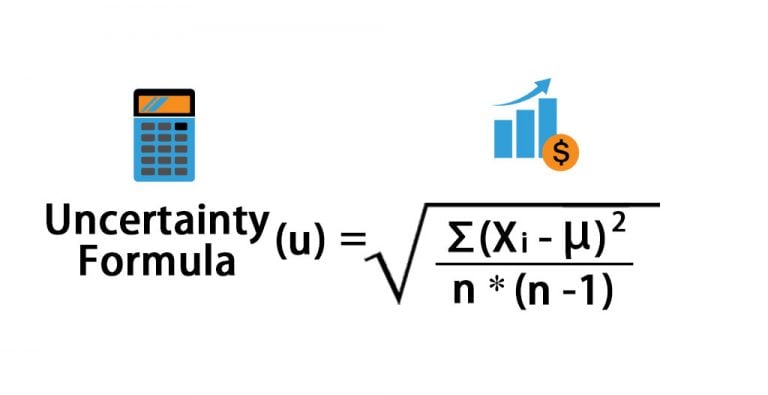
One of the simplest ways to calculate the uncertainty in your data set is by using Excel's STDEV.P function, which computes the population standard deviation:
=STDEV.P(number1, [number2], ...)
To calculate uncertainty:
- Select an empty cell where you want the uncertainty to appear.
- Enter the function =STDEV.P(A1:A20) where A1:A20 represents your range of data points.
- Press Enter, and Excel will display the standard deviation of your dataset, which you can interpret as a measure of uncertainty.
📝 Note: STDEV.P calculates the population standard deviation. For a sample standard deviation, use STDEV.S instead.
2. Constructing Confidence Intervals
Confidence intervals provide a range where the true population parameter lies with a certain level of confidence. Here’s how to calculate it:
=CONFIDENCE.NORM(alpha, standard_dev, size)
Where:
- alpha is the significance level (1 - confidence level).
- standard_dev is the standard deviation from STDEV.P or STDEV.S.
- size is the number of data points in your dataset.
Steps to calculate:
- Determine the confidence level you desire (e.g., 95% or 0.05 for alpha).
- Use the formula in a cell to get the confidence interval for your mean:
=Average(A1:A20) ± CONFIDENCE.NORM(0.05, STDEV.P(A1:A20), 20)
3. Error Propagation Method

| Function | Description | Formula |
|---|---|---|
| Sum/Average | Uncertainties add in quadrature | √(ΣU²) |
| Multiplication/Division | Fractional uncertainties add | √(Σ(Ux/X)²) |
| Power Functions | Scaled by the power | |power| x (U/X) |
Here’s how you can apply this method in Excel:
- Identify the type of calculation (sum, product, etc.) you are performing on uncertain values.
- Use the relevant formulas to combine uncertainties:
- For a sum or average of uncertain values:
=SQRT(SUMSQ(B1:B5)) - For multiplication or division:
=SQRT(SUM((C1/A1)^2, (C2/A2)^2))
📝 Note: Ensure all calculations are performed correctly; errors in cell references can lead to incorrect uncertainty estimations.
4. Using Monte Carlo Simulation
This method involves running many simulations to assess the variability in results due to input uncertainties. Here’s a basic approach in Excel:
- Set up your data and the parameters for each variable's uncertainty (mean and standard deviation).
- Use the RANDBETWEEN or NORM.INV function to generate random values around the mean within the bounds of uncertainty.
- Run a macro or manually iterate to calculate the function outcome numerous times, recording results each time.
- Analyze the distribution of outcomes to determine the uncertainty in your final result.
📝 Note: Monte Carlo Simulation requires understanding of VBA for more complex iterations or bulk calculations.
5. Utilizing Solver Add-in for Uncertainty Analysis
Excel's Solver can also be used for uncertainty analysis, particularly when optimizing parameters within a model with known uncertainties:
- Install and access the Solver add-in.
- Define your model with variables and constraints that include uncertainty ranges.
- Set Solver to minimize or maximize your objective function while varying these uncertain parameters.
- The results provide not only the optimized values but also insights into how different uncertainties affect the model output.
In summary, calculating uncertainty in Excel isn’t just about applying formulas; it’s about understanding the implications of your data, the context of your experiment or analysis, and selecting the method that best fits your needs. From using built-in functions like STDEV.P and CONFIDENCE.NORM for straightforward statistical uncertainties, to employing error propagation for more complex scenarios, or even diving into the world of simulations with Monte Carlo, Excel provides a versatile platform to manage uncertainty effectively. As you refine your skills in data analysis, these methods will become second nature, enhancing the credibility and reliability of your results.
For further exploration into Excel’s capabilities or specific technical issues, here are some commonly asked questions:
What’s the difference between STDEV.P and STDEV.S in Excel?
+STDEV.P calculates the standard deviation for an entire population, whereas STDEV.S estimates it for a sample from the population, adjusting for the smaller sample size.
How can I ensure my uncertainty calculations are accurate?
+Ensure data integrity, understand the theoretical underpinnings of your calculations, double-check your formulas, and use appropriate functions. Also, consider cross-validating with another tool or method if possible.
Can Excel simulate scenarios for uncertainty analysis?
+Yes, using tools like the Monte Carlo simulation or Solver, you can simulate various scenarios to analyze how different uncertainties affect your outcomes.
Related Terms:
- pH uncertainty calculation Excel
- Uncertainty formula
- How to calculate random uncertainty
- formula to calculate uncertainty
- measurement uncertainty calculation examples
- uncertainty calculator excel free download


