5 Ways to Calculate P-Value in Excel Easily

When it comes to statistical analysis in the fields of business, economics, healthcare, and beyond, the calculation of the P-value plays an essential role. The P-value tells us the probability of obtaining results at least as extreme as the observed results of a statistical hypothesis test, assuming that the null hypothesis is correct. Excel, with its array of powerful statistical tools, provides several methods to compute this crucial statistic. Here are five straightforward ways to calculate the P-value in Excel, ensuring you can quickly analyze your data with confidence.
Method 1: Using t-Test Functions
If you’re comparing the means of two groups or testing hypotheses about sample means, Excel’s t-Test functions come in handy:
- T.TEST Function:
This function calculates the probability associated with the Student's t-test. The syntax is
=T.TEST(array1, array2, tails, type)where:array1, array2- Are the data sets or ranges of the two samples to compare.tails- Determines whether the function calculates a one-tailed or two-tailed t-test (1 or 2).type- Defines the type of t-test (1 for paired, 2 for two-sample equal variance, 3 for two-sample unequal variance).
📝 Note: When using T.TEST, ensure that your data is normally distributed for accurate results.
Method 2: Chi-Square Test
For categorical data, when testing the independence of two variables or goodness of fit, the Chi-square test is employed:
- CHISQ.TEST Function:
Use this function for testing observed versus expected frequencies. The formula is
=CHISQ.TEST(actual_range, expected_range). This function will provide the P-value, indicating how closely your observed data matches the expected data.
Method 3: Z-Test
Z-tests are useful when sample sizes are large, or population standard deviations are known:
- Z.TEST Function:
This function tests whether the mean of a sample differs significantly from a known population mean. The syntax is
=Z.TEST(array, x, sigma), where:array- The range or array containing the sample data.x- The hypothesized population mean.sigma- The population standard deviation (optional, defaults to the sample standard deviation if omitted).
Method 4: ANOVA
Analysis of Variance (ANOVA) helps compare means among groups when there are more than two groups:
- Anova: Single Factor:
In the Data Analysis toolpak, you can run ANOVA to get the F and P-values. Navigate to "Data" > "Data Analysis" > "Anova: Single Factor" to input your data ranges.
Method 5: Regression Analysis
Regression can provide P-values for testing the significance of regression coefficients:
- Regression Analysis:
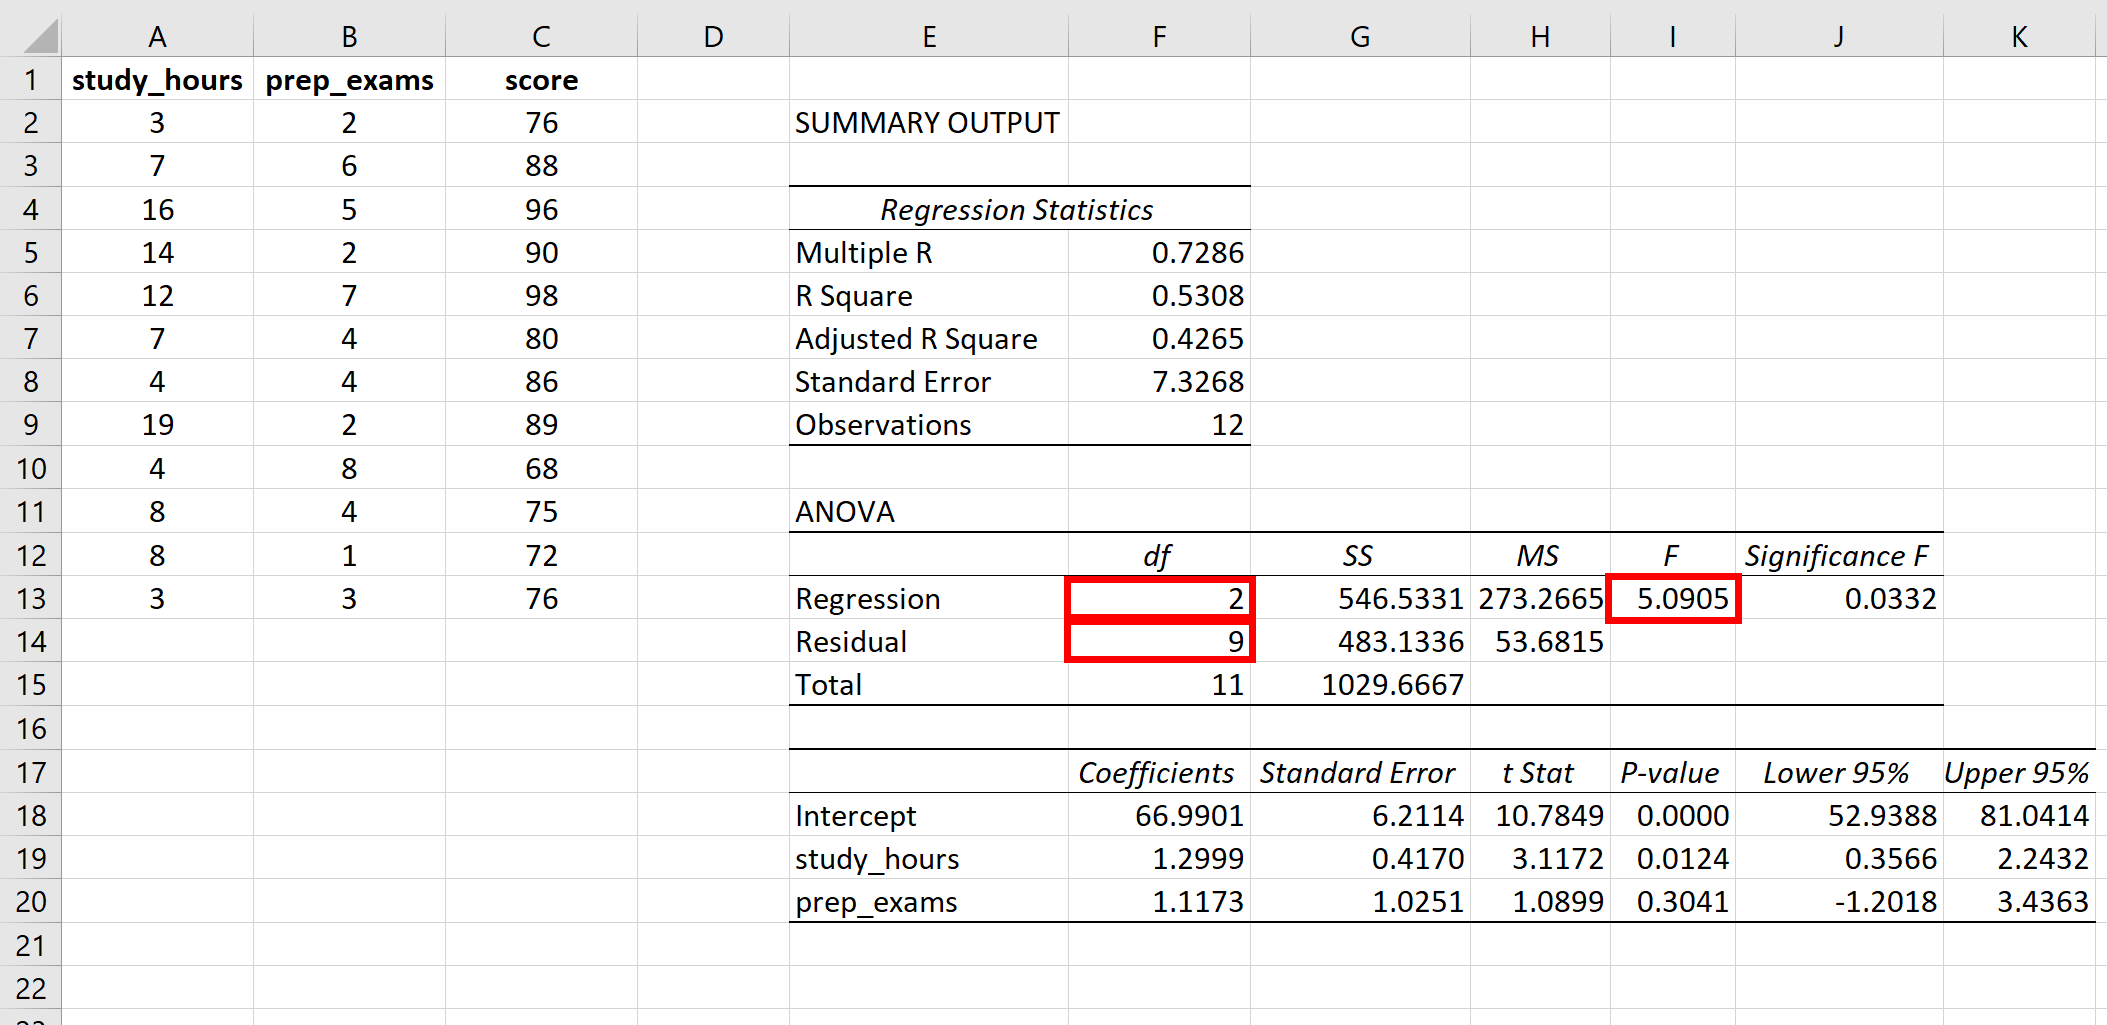
Using Excel’s Regression tool from the Data Analysis toolpak, you get the P-value for each predictor variable in your model. Select "Data" > "Data Analysis" > "Regression" to input your variables.
💡 Note: Ensure your regression model meets the assumptions (linearity, normality, independence, homoscedasticity) for accurate P-value calculation.
Calculating the P-value in Excel isn't just about running tests; it's about understanding the significance of your data in the context of your research or analysis. By choosing the appropriate statistical test, you not only ensure the validity of your results but also enrich your understanding of the data at hand. Each method mentioned above provides a unique lens through which your data can be analyzed, offering insights into relationships, differences, and influences within your dataset. Whether you're looking to validate a hypothesis or explore new ground, these five methods of calculating P-value in Excel empower you to make informed decisions with statistical rigor.
What is a P-value and why is it important?
+The P-value represents the probability that the data would be at least as extreme as those observed, under the assumption that the null hypothesis is true. It is crucial for determining the statistical significance of results, helping researchers decide whether to reject the null hypothesis.
Can I calculate the P-value for any kind of data?
+P-values can be calculated for various types of data, but the method of calculation depends on the type of statistical test and the nature of your data. Different tests are suited for continuous versus categorical data, normal versus non-normal distributions, etc.
How do I interpret a high P-value?
+A high P-value (typically greater than 0.05) suggests that there is not enough evidence to reject the null hypothesis, implying that the observed data can easily occur by chance under the null hypothesis. It does not prove the null hypothesis but indicates lack of statistical significance.
Does Excel require the Data Analysis Toolpak for all P-value calculations?
+No, some P-value calculations like t-Tests, Chi-Square Tests, and Z-Tests can be performed using built-in functions without the Data Analysis Toolpak. However, for ANOVA and regression analysis, this toolpak is necessary for full functionality.
Are there alternatives to using Excel for P-value calculations?
+Yes, there are many statistical software alternatives to Excel like R, SPSS, SAS, or Python with libraries like SciPy and Statsmodels, which offer more advanced statistical analysis capabilities.
Related Terms:
- P value Excel
- P value Correlation in Excel
- Kalkulator p-value
- T statistic calculator
- Standard test calculator
- p value t test excel


