Excel Sample Size Calculation: A Simple Guide

In today's data-driven world, understanding and calculating sample sizes is crucial for researchers, businesses, and students alike. Whether you're conducting market research, running experiments, or performing statistical analyses, determining an appropriate sample size can significantly impact the validity of your findings. This guide aims to provide a straightforward approach to calculating sample sizes using Microsoft Excel, a tool widely accessible and user-friendly for such computations.
Why Sample Size Matters

Before diving into the how-to, it’s important to grasp why sample size calculation is vital:
- Precision: Larger samples reduce the margin of error, providing more precise estimates.
- Reliability: Adequate sample sizes ensure your results can be generalized to a larger population with confidence.
- Resource Management: Calculating the sample size helps in planning resources efficiently, saving time and money by avoiding over or under-sampling.
Steps to Calculate Sample Size in Excel
Here’s how you can calculate the sample size using Excel:
Step 1: Define Parameters
- Population Size (N): The total number of individuals in the population.
- Confidence Level (Z): Typically set at 95% or 99%, corresponding to Z-scores of 1.96 and 2.58 respectively.
- Expected Proportion (p): An estimate of the proportion of the population that exhibits a particular trait or characteristic, often set to 0.5 for maximum variance.
- Margin of Error (e): The acceptable error you’re willing to tolerate in your estimate.
Step 2: Use the Sample Size Formula
Plug the above parameters into the following formula:
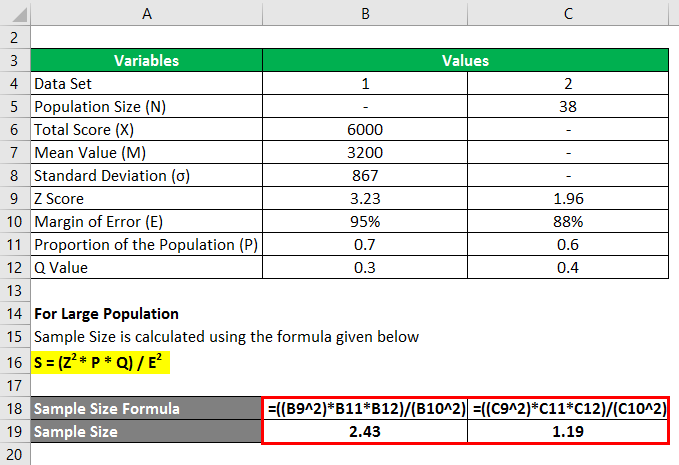
n = (Z^2 * p * (1-p) / e^2) / (1 + ((Z^2 * p * (1-p)) / (e^2 * N)))
Where:

| Symbol | Description |
|---|---|
| n | Sample Size |
| Z | Z-Score for the chosen confidence level |
| p | Expected Proportion |
| e | Margin of Error |
| N | Population Size |
Step 3: Excel Implementation
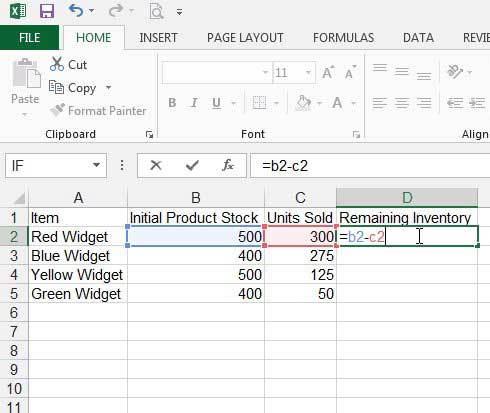
- Open Microsoft Excel and enter your parameters into cells:
- Calculate each component of the formula in separate cells:
- In cell A2, type
=1.96^2for a 95% confidence level. - In cell B2, type
=0.5for expected proportion if unknown. - In cell C2, type
=0.05for a 5% margin of error. - In cell D2, type
=5000for the population size, adjusting as needed.
- In cell A2, type
- In another cell (E2), compute the sample size using:
=E2 = (A2 * B2 * (1-B2) / C2^2) / (1 + ((A2 * B2 * (1-B2)) / (C2^2 * D2)))
💡 Note: Round up the final sample size to the nearest whole number since partial individuals aren’t feasible.
Step 4: Adjusting for Finite Population Correction
If your sample is more than 5% of the population, you should apply the Finite Population Correction (FPC) factor to avoid overestimating the sample size:
- Adjust your calculation to include FPC:
n = ((Z^2 * p * (1-p) / e^2)) / (1 + ((Z^2 * p * (1-p)) / (e^2 * N))) * ((N - n) / (N - 1)) - In Excel, you might need to iteratively calculate ‘n’ as it appears in both the numerator and denominator of the FPC formula.
Key Takeaways
As we’ve explored, calculating sample size in Excel isn’t just about plugging numbers into a formula. It involves understanding the underlying statistical concepts, ensuring your research or analysis is both efficient and credible. Here are the main points to remember:
- Determining Parameters: Be precise with your confidence level, margin of error, and expected proportion to get a reliable sample size.
- Using Excel: Excel simplifies the calculation process, making it accessible to those who might not be experts in statistics.
- Adjustments: Apply FPC for small populations or large sample sizes to avoid overestimation.
- Interpretation: Remember that sample size is just the first step. Proper implementation of your research methodology is equally important.
What is the difference between sample size and population size?
+The population size is the total number of individuals or items you’re interested in studying. The sample size is the subset of these you actually analyze for your research. The sample size should be representative enough of the population to make general conclusions.
Can I use the same sample size calculation for all types of research?
+No, the formula for sample size varies with the type of study (e.g., surveys vs. experiments), the type of analysis (mean, proportion), and the desired precision. The method outlined above is suitable for proportions in surveys with large populations.
How do I ensure my sample size is sufficient?
+Ensure your sample size accounts for:
- Your study’s confidence level.
- The desired margin of error.
- Any known variability within the population.
- Possible non-responses or dropouts.
What if my population is small or hard to reach?
+For small populations, you might use the finite population correction. For hard-to-reach populations, consider techniques like stratified sampling or snowball sampling to ensure representativeness within the constraints of accessibility.
Related Terms:
- Sample size formula Excel Template
- Sample size calculation problems
- Audit sample size calculator excel
- Excel file size calculator
- audit sample size calculator excel
- sample size formula with example


