5 Simple Steps to Normalize Data in Excel

Step 1: Understanding Your Data
Before you start normalizing data in Excel, it's crucial to understand the nature and the types of data you're dealing with. Data normalization, also known as scaling or feature scaling, is a process used to change the values in the dataset to a common scale, without distorting differences in the ranges of values or losing information.
- Quantitative Data: This includes numerical data that can be measured. You might have different scales or units which require normalization.
- Qualitative Data: Categorical data might need encoding or normalization in a different sense, like binary coding.
Step 2: Choose Your Normalization Method
There are several methods to normalize data in Excel:
- Min-Max Normalization: This technique scales the data to a range typically between 0 and 1.
- Standard Score (Z-score): This method converts the values into a distribution with a mean of 0 and a standard deviation of 1.
- Log Transformation: Useful for reducing skewness when data has large ranges of values.
- Mean Normalization: This scales the data so that the mean of the transformed data will be 0, but the range can vary.
Step 3: Perform Min-Max Normalization
Min-Max normalization is one of the simplest methods:
Formula:
Xnorm = (X - Xmin) / (Xmax - Xmin)
Here's how you can apply it in Excel:
- Identify Xmin and Xmax: Find the minimum and maximum values of the dataset.
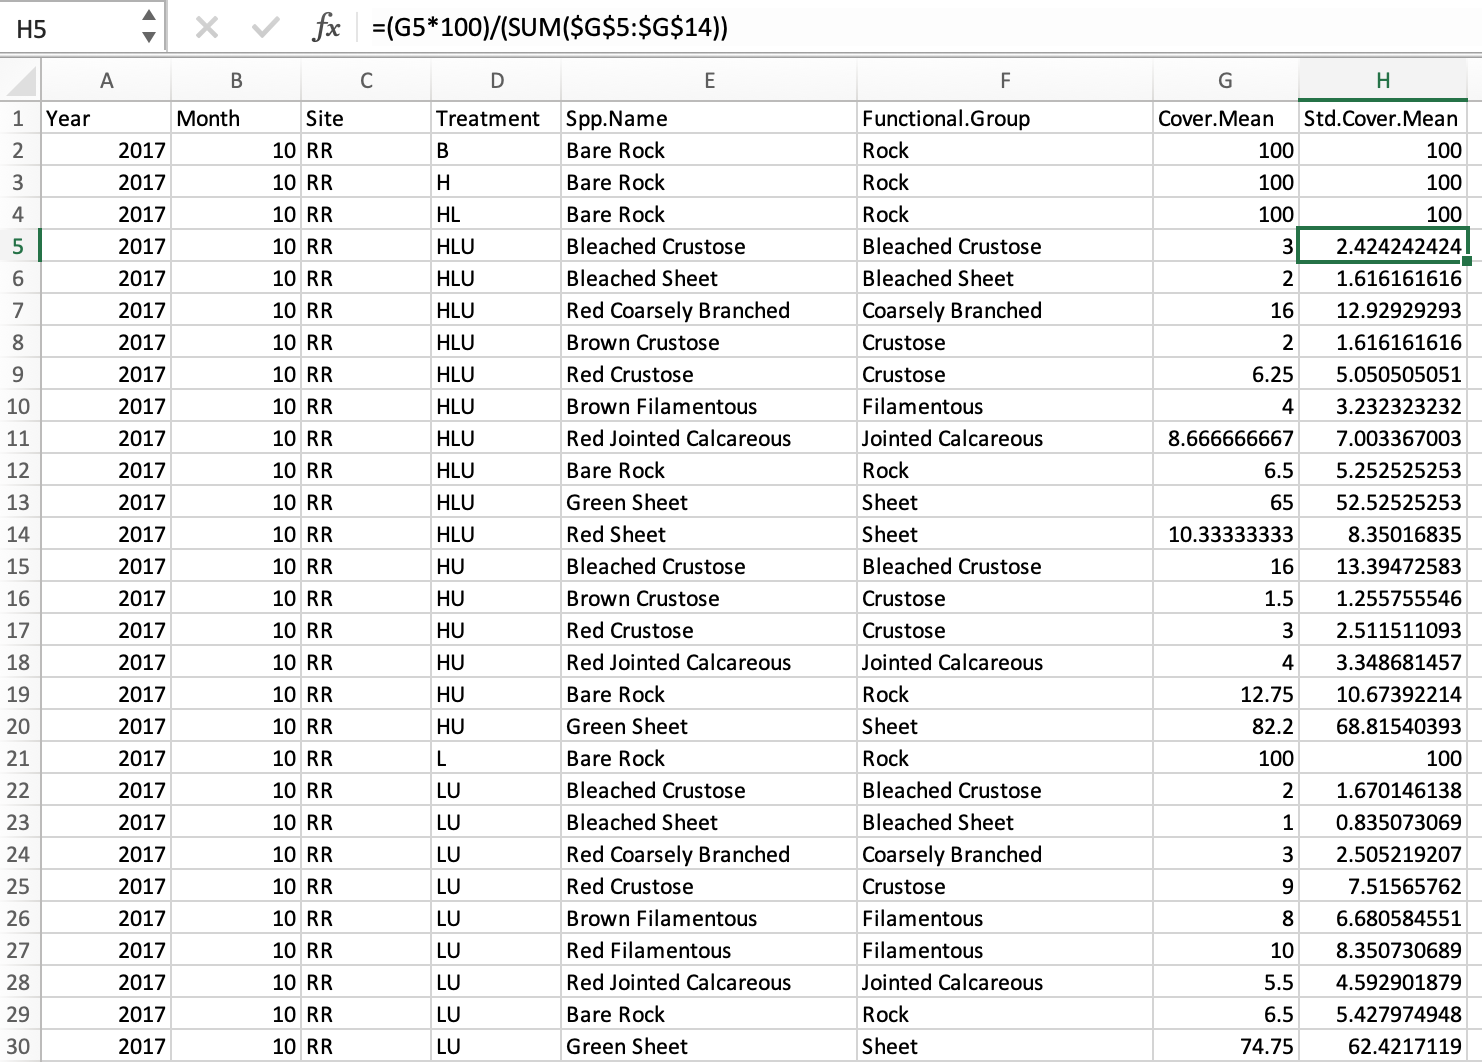
- Apply the formula: Enter the formula in a new column next to your original data:
= (A2 - MIN(A:A)) / (MAX(A:A) - MIN(A:A))
🌟 Note: Ensure that you select the correct cell references for your data range when calculating the min and max.
Step 4: Apply Z-Score Normalization
Z-Score normalization transforms data to a distribution with a mean of 0 and standard deviation of 1. Here’s the process:
Formula:
Z = (X - μ) / σ
Where:
- X is your data point
- μ is the mean of the dataset
- σ is the standard deviation of the dataset
Here's how to do it in Excel:
- Calculate the Mean: Use the AVERAGE function.
- Calculate the Standard Deviation: Use the STDEV.P or STDEV.S function.
- Apply the formula:
= (A2 - AVERAGE(A:A)) / STDEV.P(A:A)
Step 5: Review and Interpret Your Normalized Data
After normalizing your data:
- Ensure that all values fall within the expected ranges for the normalization method you've used.
- Check for any anomalies or data points that might require further investigation or alternative normalization techniques.

| Method | Expected Result |
|---|---|
| Min-Max | 0 to 1 |
| Z-Score | Mean = 0, SD = 1 |
Understanding and interpreting normalized data can help in:
- Comparative analysis across different data sets.
- Improving the performance of machine learning algorithms by providing consistency in input scale.
As we've gone through the process of normalizing data in Excel, it becomes evident that this procedure is not just about making numbers smaller or more manageable. It's about preparing your data for analysis where scale differences won't skew results. The methods discussed, especially Min-Max and Z-Score normalization, are widely used due to their simplicity and effectiveness. Keep in mind that each dataset might require different handling; thus, understanding your data is paramount.
Why should I normalize my data in Excel?
+
Normalization ensures that different variables with different ranges and units are brought to a common scale, making them directly comparable. This is crucial for analysis techniques like regression analysis, clustering, or when using machine learning algorithms where the scale of inputs matters.
Can normalizing data change the outcome of my analysis?
+
Yes, especially if your analysis involves comparing variables with large disparities in scale. Normalization can help prevent one variable from dominating the others due to its larger scale, which could skew results if not properly addressed.
What if my data has outliers, should I still normalize?
+
Outliers can influence the normalization process, particularly with methods like Z-Score where the mean and standard deviation are sensitive to extreme values. Consider addressing outliers before normalization, or choose robust normalization techniques like Winsorizing or Robust Scalers.
Does normalizing data affect the correlation between variables?
+
Normalization does not change the correlation between variables, but it does make the relationships clearer and more comparable, especially when dealing with datasets where the original scales differ significantly.
Related Terms:
- Normalized min max
- Cara Normalisasi Data di Excel
- normalize data calculator
- how to calculate normalized value
- formula to normalize data
- standardize formula in excel


