How to Conduct ANOVA in Excel Easily

ANOVA, or Analysis of Variance, is a statistical method used to test differences between two or more means. This technique is particularly useful when you need to compare several groups or treatments simultaneously to assess their effect on a particular outcome. Whether you're a student, researcher, or professional, knowing how to perform ANOVA in Excel can streamline your data analysis workflow. Let's dive into the step-by-step process of conducting ANOVA in Excel, making it both easy and efficient.
Preparing Data for ANOVA

Before performing ANOVA, ensure your data is organized correctly:
- Input your data into a tabular format in Excel.
- Label your columns with the different groups or treatments.
- Place your dependent variable (the outcome you're measuring) in rows beneath each group.
Accessing the Data Analysis Toolpak
To conduct ANOVA in Excel, you'll need the Data Analysis Toolpak:
- Open Excel and click on 'File' in the top-left corner.
- Choose 'Options' and then select 'Add-Ins'.
- In the Manage box, select 'Excel Add-ins' and click 'Go'.
- Check 'Analysis Toolpak' and click 'OK'.
💡 Note: If you do not see the Data Analysis option in the 'Data' tab, you might need to install this Add-in by following the above steps.
Performing One-Way ANOVA
For one-way ANOVA, which compares means across a single factor with several levels, follow these steps:
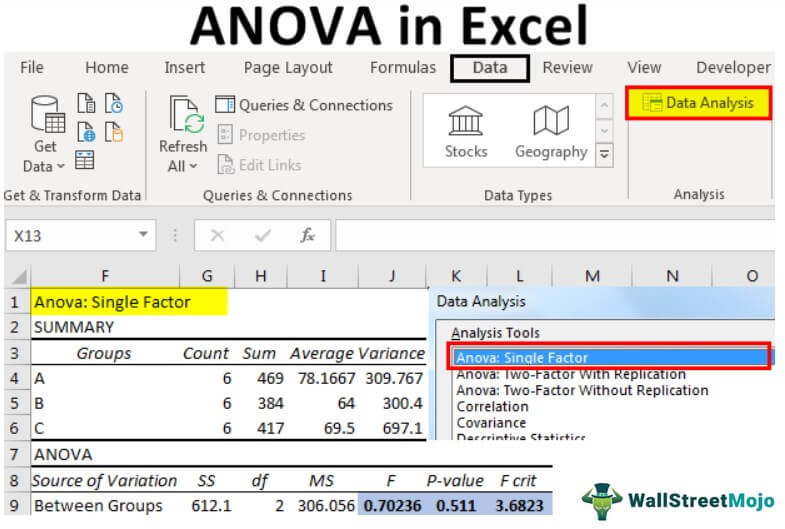
- Navigate to the ‘Data’ tab and select ‘Data Analysis’.
- Choose ‘Anova: Single Factor’ from the list and click ‘OK’.
- In the dialog box, input your data range (including the labels).
- Select an output range in your Excel worksheet or choose a new worksheet for the results.
- Check ‘Labels’ if you included column headers in your data range.
- Click ‘OK’ to perform the analysis.
Interpreting One-Way ANOVA Results

| Output | Description |
|---|---|
| F statistic | This value indicates the ratio of between-group variability to within-group variability. A higher F value suggests significant differences between group means. |
| p-value | If this value is less than your significance level (often 0.05), you reject the null hypothesis, indicating there’s a significant difference between group means. |
| F critical | This is the critical value from the F distribution; if your F statistic exceeds this, it’s significant at the chosen level. |
🔍 Note: Ensure you understand the assumptions of ANOVA (normality, homogeneity of variances, and independence) before interpreting your results for validity.
Two-Way ANOVA with Replication
Two-way ANOVA allows you to analyze the effects of two factors simultaneously. Here’s how to proceed:
- Select ‘Anova: Two-Factor With Replication’ from the Data Analysis list.
- Specify your data range, noting that each combination of factors should be repeated for replication.
- Input the number of rows per sample (e.g., the number of observations in each group for each combination of factors).
- Choose where to output the results and click ‘OK’.
Interpreting Two-Way ANOVA Results
- Source of Variation: This table shows variance due to Factor A, Factor B, their interaction, and the within-group variance.
- F statistic for each factor and interaction helps determine if there’s a significant effect or interaction.
- The p-value provides statistical significance. A p-value below your significance level means the effect or interaction is significant.
💡 Note: Two-way ANOVA is great for understanding not only main effects but also how factors interact with one another.
Mastering ANOVA in Excel requires an understanding of its assumptions and how to interpret the results. Here are some key points to keep in mind:
- Ensure your data is structured correctly for analysis.
- Utilize Excel's Data Analysis Toolpak to simplify the ANOVA process.
- Correctly interpret the F statistic, p-value, and understand the implications of your results.
In summary, Excel is a powerful tool for conducting ANOVA, offering easy access and straightforward interpretation of statistical outputs. By following the steps outlined, you can perform ANOVA for comparing means across groups with minimal complexity. Understanding how to apply and interpret ANOVA results in Excel will enhance your analytical capabilities, aiding in better decision-making and insight generation from data.
What is the difference between one-way and two-way ANOVA?
+
One-way ANOVA tests for differences among group means for a single independent variable. Two-way ANOVA, however, looks at the effects of two independent variables and their interaction on a dependent variable.
Can I perform ANOVA if my data doesn’t meet the assumptions?
+
ANOVA assumes normality of residuals, homogeneity of variances, and independence. If these assumptions aren’t met, alternatives like non-parametric tests (Kruskal-Wallis for one-way, or robust ANOVA) might be more appropriate.
How do I handle missing data in Excel for ANOVA?
+
You can either exclude cases with missing data, use imputation methods to fill in missing values, or use statistical software that can handle missing data more effectively than Excel’s basic capabilities.
Related Terms:
- Rumus anova di Excel
- ANOVA single factor
- Kalkulator ANOVA
- Post hoc Analysis in Excel
- Rumus Anova manual
- ANOVA two factor without Replication


