7 Ways to Count Data Points in Excel Quickly

Exploring the Basics of Data Counting in Excel
Data analysis is an integral part of any business, academic, or personal project. Microsoft Excel, with its robust functionalities, stands as a leading tool for such tasks. Whether you’re summarizing sales figures or analyzing survey results, counting data points is a fundamental operation. Here are seven efficient ways to quickly count data in Excel:
- Using the COUNT function
- Leveraging the COUNTA function
- Employing the COUNTIF function
- Utilizing the COUNTIFS function
- Using the SUBTOTAL function
- Implementing the AGGREGATE function
- Visual Counting with Pivot Tables
1. Using the COUNT Function
The COUNT function in Excel is ideal for quickly summing the number of cells that contain numbers.
=COUNT(range)
Where:
- range is the group of cells you want to count.
Example: If you have a list of product prices in cells A1 through A10, =COUNT(A1:A10) will return the count of cells containing a numeric value within that range.
📌 Note: COUNT only counts cells with numeric values. Empty cells, cells with text, or errors will not be counted.
2. Leveraging the COUNTA Function
When your data includes not only numbers but also text or other forms of data, the COUNTA function comes into play.
=COUNTA(range)
Where:
- range is the set of cells you want to analyze.
Example: To count the total entries in a column with mixed data, use =COUNTA(B1:B20).
3. Employing the COUNTIF Function
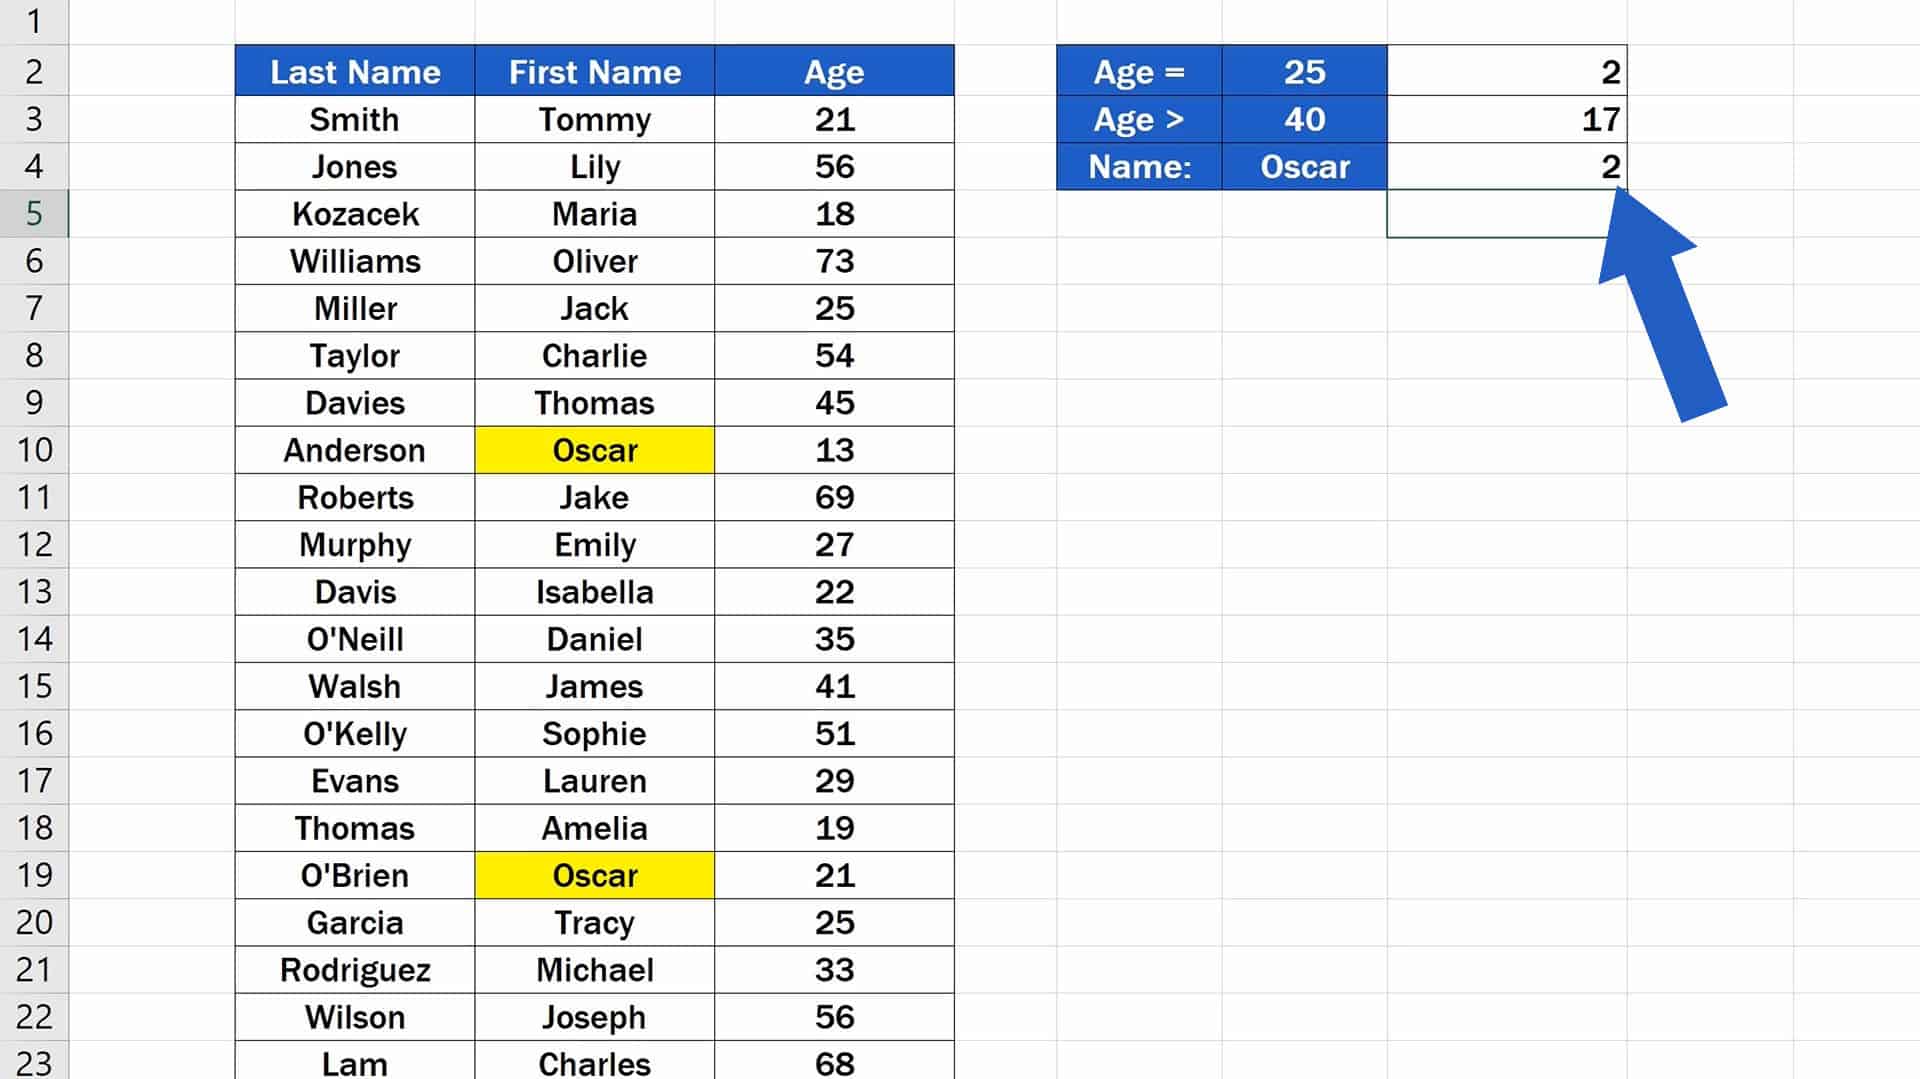
The COUNTIF function allows you to count cells based on a specified condition.
=COUNTIF(range, criteria)
Where:
- range is the range of cells you want to apply the condition to.
- criteria is the condition that determines which cells to count.
Example: To count how many cells in a range contain the word “Apple”, use =COUNTIF(C1:C25, "Apple").

| Item | Count |
|---|---|
| Apple | 10 |
| Orange | 5 |
| Banana | 8 |
📌 Note: COUNTIF is flexible with conditions. You can use numeric values, text strings, or even cell references for the criteria.
4. Utilizing the COUNTIFS Function
When you need to count data based on multiple criteria, COUNTIFS is your go-to function.
=COUNTIFS(range1, criteria1, range2, criteria2, ...)
Where:
- Each range is the range of cells you want to apply a condition to.
- Each criteria is the condition for counting.
Example: If you want to count how many products sold more than 100 units and were priced above $20, you could use:
=COUNTIFS(A1:A10, ">100", B1:B10, ">20")
5. Using the SUBTOTAL Function
The SUBTOTAL function provides a way to count or perform various calculations, excluding rows that are hidden or filtered out.
=SUBTOTAL(function_num, ref)
Where:
- function_num is the code for the function you want to perform (e.g., 3 for COUNT).
- ref is the reference to the range you want to subtotal.
Example: To count visible cells in column D, ignoring any filters or hidden rows, use =SUBTOTAL(3, D:D).
6. Implementing the AGGREGATE Function
The AGGREGATE function is similar to SUBTOTAL but offers more options for ignoring errors and hidden rows.
=AGGREGATE(function_num, options, array, [k])
Where:
- function_num specifies the function to use (e.g., 3 for COUNT).
- options controls how to handle errors, hidden rows, and filters.
- array is the range to aggregate.
- [k] is optional, specifying which result to return if the function has multiple results.
Example: To count all cells in A1:A20 while ignoring errors:
=AGGREGATE(3, 6, A1:A20)
7. Visual Counting with Pivot Tables
Pivot Tables provide a dynamic way to count data points. Here’s how you can use them for quick data analysis:
- Select the range of data you want to analyze.
- Go to the Insert tab and click on PivotTable.
- Choose where you want the Pivot Table to be placed.
- Drag the field you want to count to the Row Labels area and then to the Values area.
In the Value field settings, you can choose Count to count occurrences of each unique item in the field.
Example: If you have sales data, dragging the ‘Product’ field to both Rows and Values will show the count of each product sold.
In wrapping up, Excel offers multiple methods to count data points. Whether you are dealing with simple lists or complex datasets, there’s a function or technique suited to your needs. Remember that knowing which tool to use can significantly enhance your productivity and analysis accuracy. The flexibility of Excel means you can often combine these methods for even more tailored solutions to your data counting challenges.
How does the COUNT function differ from COUNTA?
+The COUNT function only counts cells with numeric values, whereas COUNTA counts all non-empty cells, regardless of the data type.
Can I count cells with a specific color in Excel?
+Excel does not have a built-in function to count cells based on their color. However, you can use VBA or add-ins to achieve this functionality.
Is it possible to count unique values in Excel?
+Yes, you can count unique values using a combination of the COUNTIF and SUMPRODUCT functions or by leveraging Advanced Filter techniques.
Related Terms:
- excel formulas for counting values


