5 Easy Ways to Calculate Percentage Averages in Excel

When working with numerical data in Excel, one of the most common tasks is calculating percentages and their averages. This skill is not only essential in academic settings but also highly valuable in various professional fields like finance, sales, education, and market research. Calculating percentage averages can help you analyze trends, gauge performance, and make data-driven decisions. Here, we'll explore five straightforward methods to perform this calculation in Microsoft Excel, ensuring you can handle your data with precision and ease.
Method 1: Using Simple Arithmetic
The most basic way to calculate the average percentage in Excel is by using simple arithmetic. Here’s how:
- Enter your percentage values in a column or row.
- Use the SUM function to add these values:
=SUM(A1:A5), assuming your percentages are in cells A1 through A5. - Divide this sum by the number of percentages using COUNT or manually:
=SUM(A1:A5)/COUNT(A1:A5)or=SUM(A1:A5)/5.
This method gives you the average of percentages directly, but it's important to ensure your percentages are already in decimal form or multiply by 100 at the end to get the percentage value.
Method 2: Using the AVERAGE Function
Excel's AVERAGE function can simplify the process of calculating percentage averages:
- Type your percentages into Excel.
- Select a cell where you want to display the average.
- Enter the formula:
=AVERAGE(A1:A5).
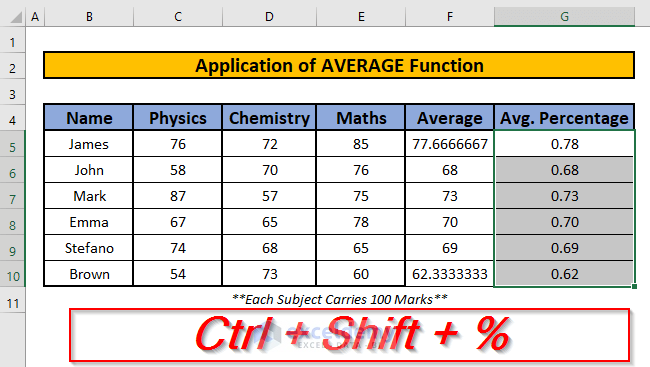
This function automatically computes the mean of the values provided. Remember to format the cell with the percentage style for correct display.
Method 3: Weighted Averages
Not all percentages are created equal. Sometimes you need to calculate a weighted average:
- List your percentages in one column (e.g., B1:B5).
- List the weights in the adjacent column (e.g., C1:C5).
- Use the SUMPRODUCT function to multiply percentages by their weights, then divide by the sum of weights:
=SUMPRODUCT(B1:B5, C1:C5)/SUM(C1:C5).
This method is particularly useful for scenarios where different items contribute differently to the overall average.
Method 4: Using Array Formulas
If you need to calculate averages across multiple criteria or complex data sets, array formulas can be your ally:
- Input your data in a range like A1:B5 with percentages in column A and categories in column B.
- Use an array formula like:
=AVERAGE(IF(B1:B5="SpecificCategory",A1:A5))then press Ctrl + Shift + Enter.
Array formulas are powerful, allowing for multi-condition calculations in a single, compact formula.
Method 5: PivotTables for Interactive Analysis
For those dealing with large datasets or needing interactive analysis:
- Select your data range.
- Insert a PivotTable.
- Drag the fields to the Rows, Columns, and Values areas.
- Choose Percentage as the value field settings to show percentages.
- From there, you can compute the average of these percentages with additional fields or calculated items.
PivotTables provide a dynamic way to analyze and summarize data, making it easier to work with percentage averages over time or across categories.
Important Notes:
⚠️ Note: When calculating percentages, ensure your data is entered correctly in Excel. Decimal numbers should be used for computation, and you can format the final result as a percentage.
🔎 Note: Weighted averages are crucial when different values have different significance, like in grading systems or financial portfolios.
✏️ Note: Array formulas can be tricky but they offer immense flexibility. Remember to press Ctrl + Shift + Enter to activate an array formula.
In wrapping up, calculating percentage averages in Excel can significantly enhance your data analysis capabilities, whether you’re dealing with simple datasets or complex reports. By mastering these methods, you’ll be equipped to handle a variety of scenarios, from academic projects to detailed financial analyses. Excel’s built-in functions and features like PivotTables streamline this process, making it accessible even for those less familiar with spreadsheets.
Why do I need to calculate percentage averages?
+Percentage averages help in understanding trends, measuring growth, assessing performance, and making comparative analyses across different sets of data.
How does the SUMPRODUCT function work for weighted averages?
+The SUMPRODUCT function multiplies arrays of numbers together and then sums up the results, allowing you to account for weights in calculating averages.
Can I use these methods for any version of Excel?
+Yes, these methods are broadly compatible with all versions of Excel, though some newer functions might not be available in very old versions.
What if my data includes text or errors?
+Ensure your data is clean before applying these functions. Excel’s ISNUMBER or IFERROR functions can help filter out errors or non-numeric values.
How can I format my results to show percentages?
+Right-click on the cell, choose ‘Format Cells’, then select ‘Percentage’ and set the number of decimal places for precision.
Related Terms:
- Format percentage Excel
- excel formula for average functions
- average calculator excel formula
- average percent difference in excel
- calculate sample mean in excel
- mean percentage score in excel


