5 Simple Excel Tricks to Calculate Frequency Easily

Mastering Excel can significantly enhance your productivity, particularly when dealing with data analysis and frequency calculations. Here are five straightforward Excel tricks that will help you calculate frequency efficiently. Each trick provides a unique solution to different frequency analysis needs, making your data management seamless and accurate.
Frequency Distribution with the FREQUENCY Function
One of the most direct ways to calculate how often values occur within a specified range in Excel is by using the FREQUENCY function. This function is particularly useful for creating frequency distributions without much manual effort.
- Steps to Use the FREQUENCY Function:
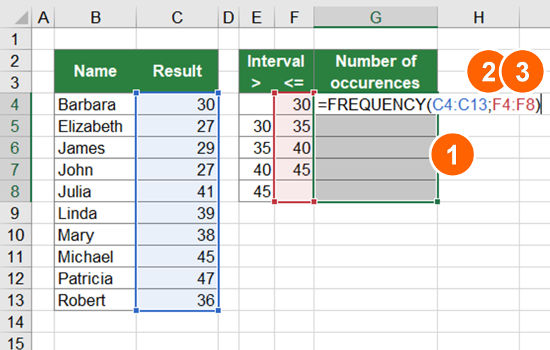
- Select the cells where you want your frequency distribution to appear. Ensure you select one cell more than the number of bins.
- Type the formula =FREQUENCY(data_array, bins_array) in the formula bar, but instead of pressing Enter, press Ctrl + Shift + Enter to create an array formula.
- Excel will automatically fill the selected cells with the frequency counts corresponding to your bin ranges.
🔍 Note: The FREQUENCY function calculates how many values fall into each of the intervals, or bins, you specify.
Using Pivot Tables for Quick Frequency Analysis
Pivot Tables in Excel offer a dynamic way to summarize and analyze data, providing an intuitive interface for frequency analysis. Here’s how you can leverage this feature:
- Steps to Use Pivot Tables for Frequency:
- Select your data range and go to Insert > PivotTable.
- Choose where you want the Pivot Table to be placed.
- Drag the field for which you want to count frequency into the Rows area and then drag the same field to the Values area. Excel will automatically create a count of occurrences for each unique entry.
Conditional Counting with COUNTIF/COUNTA Functions
If your frequency calculation needs are more specific, Excel’s COUNTIF and COUNTA functions can be your go-to tools:
- COUNTIF:
- Use =COUNTIF(range, criteria) to count the number of cells that meet a condition, like counting how many times a specific value appears.
- COUNTA:
- Employ =COUNTA(range) to count all non-empty cells in a range, which can be useful for understanding overall data entry frequency.
Creating Histograms for Visual Frequency Representation
Histograms provide a visual representation of frequency distributions. Here’s how to create one in Excel:
- Creating a Histogram:
- Select your data.
- Go to the Insert tab, choose the Histogram chart from the Charts group.
- Adjust the bin width or set your own bins in the Format Axis options for better control over the frequency distribution visualization.

| Excel Version | Histogram Feature |
|---|---|
| 2016 and later | Built-in Histogram Chart |
| Before 2016 | Use Analysis ToolPak add-in |
Advanced Frequency Analysis with Data Analysis ToolPak
Excel’s Data Analysis ToolPak provides more advanced statistical tools for frequency analysis. Here’s how to use it:
- Installing Data Analysis ToolPak:
- Go to File > Options > Add-ins > Manage Excel Add-ins > Go.
- Check the box for Analysis ToolPak and click OK to install.
- Using Histogram Tool:
- Go to Data > Data Analysis > Histogram.
- Choose your input range, bin range, and where to place the output.
- Optionally, you can generate a chart directly from this tool.
💡 Note: The Data Analysis ToolPak enhances Excel's capabilities for complex data analysis, making it indispensable for statistical work.
By mastering these five Excel tricks for calculating frequency, you streamline your data analysis process. Whether you're looking to quickly summarize data with Pivot Tables, create visual representations with histograms, or perform sophisticated analysis using the ToolPak, these methods cover a wide range of needs. Integrating these techniques into your routine ensures you're equipped to handle frequency calculations with greater efficiency and accuracy, enhancing your overall Excel proficiency.
What are the benefits of using frequency distribution in Excel?
+Frequency distribution in Excel helps to visualize how often different values occur within a data set, making it easier to identify patterns, trends, or anomalies which are critical for data analysis.
How can Pivot Tables enhance frequency analysis?
+Pivot Tables enable quick summarization and counting of data. They dynamically adjust to changes in the underlying data, allowing for real-time analysis which is invaluable for tracking frequency changes over time.
Can COUNTIF be used for complex conditions?
+Absolutely. COUNTIF can work with multiple conditions using the COUNTIFS function, allowing for intricate frequency counting based on various criteria.
Why create a histogram in Excel for frequency analysis?
+Histograms provide a graphical representation of data distribution, which can quickly convey information about the shape, spread, and skewness of the data, making it easier to interpret large data sets.
What makes the Data Analysis ToolPak useful for frequency analysis?
+The Data Analysis ToolPak provides statistical tools like regression, descriptive statistics, and more, allowing for a deeper analysis of frequency data with statistical context, which is crucial for comprehensive data insights.
Related Terms:
- FREQUENCY Excel
- FREQUENCY formula Excel
- calculate frequency distribution in excel
- frequency formula on excel
- excel frequency table
- calculate frequency function in excel


