5 Steps to Calculate Cpk in Excel Easily

Introduction to Cpk in Quality Control
Process Capability Index (Cpk) is a crucial statistical tool used in the realm of manufacturing and quality control. It provides insights into how well a process is performing relative to its specified limits. Cpk is particularly useful because it considers both the spread of the process output and its centering within specification limits. Here’s how you can calculate Cpk in Excel easily with these five steps:
Step 1: Collecting Data and Entering into Excel
The first step in calculating Cpk is to gather your data. This can come from:
- Measurements of a product or service
- Production data
- Quality control tests
Ensure the data is:
- Accurate and consistent
- Representative of the entire process
- In a format that can be easily processed in Excel
📝 Note: Data quality impacts the accuracy of Cpk calculation. Ensure your data is clean and well-organized before proceeding.
Step 2: Finding the Upper and Lower Specification Limits (USL & LSL)
Next, you need to determine the specification limits:
- Upper Specification Limit (USL): The maximum acceptable value
- Lower Specification Limit (LSL): The minimum acceptable value
These limits are usually provided by the process specifications or industry standards. Enter these values into your Excel spreadsheet:

| Parameter | Value |
|---|---|
| USL | [Enter USL Value] |
| LSL | [Enter LSL Value] |
Step 3: Calculating Mean and Standard Deviation
Use Excel functions to calculate:
- Average (Mean): Use the
=AVERAGE()function - Standard Deviation: Use the
=STDEV.S()or=STDEV.P()functions for sample or population respectively
Here’s how:
- Select a cell to enter the mean.
- Type
=AVERAGE(A2:A100)assuming your data starts in cell A2 and ends at A100. - Select another cell to enter the standard deviation.
- Type
=STDEV.S(A2:A100)for the sample standard deviation.
Step 4: Computing the Cpk
Once you have your mean and standard deviation, the formula to calculate Cpk is:
Cpk = min((USL - Mean) / (3 * Sigma), (Mean - LSL) / (3 * Sigma))
Here’s how to apply this formula in Excel:
- Select an empty cell.
- Type
=MIN((USL-DataMean)/(3*DataSD),(DataMean-LSL)/(3*DataSD)), replacing “USL”, “LSL”, “DataMean”, and “DataSD” with the corresponding cell references or named ranges.
Step 5: Interpretation of Cpk
Once you’ve calculated Cpk, here’s how to interpret it:
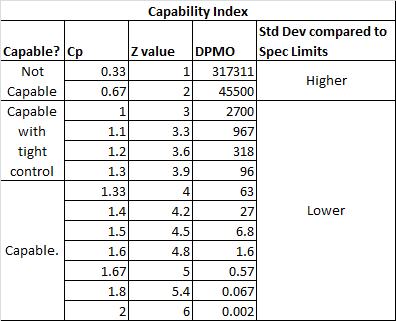
- Cpk > 1.33: The process is considered highly capable with very little risk of defects.
- 1.0 < Cpk < 1.33: The process is capable but could use some improvement.
- Cpk < 1.0: The process is not capable, and significant issues exist that need immediate attention.
The final wrap-up to our journey through calculating Cpk in Excel reveals that having a reliable tool like this is essential for anyone involved in process improvement or quality control. By following these straightforward steps, you can assess the capability of your process in a matter of minutes, enabling you to:
- Identify where your process might be failing.
- Guide decisions on process adjustments or improvements.
- Communicate process capability effectively to stakeholders.
Remember, Cpk provides valuable information about process variability and centering, helping you ensure your products or services meet customer expectations. With continuous monitoring and improvement, you can keep your process within specification limits, ensuring high quality and reliability.
What does Cpk tell us about a process?
+Cpk indicates the ability of a process to meet its specification limits. It takes into account both the variability and centering of the process within those limits. A high Cpk value suggests that the process is performing well within its specifications, resulting in fewer defects.
Can I use Cpk for any type of data?
+Cpk is best used with continuous, quantitative data. For categorical or non-normal data, other capability indices like Ppk or specific methodologies might be more appropriate.
How often should I calculate Cpk?
+It’s good practice to calculate Cpk regularly, especially after changes to the process or on a set schedule (e.g., monthly or quarterly), to ensure process performance remains stable and within specifications.
What if my Cpk is negative?
+If your Cpk calculation results in a negative value, there’s likely an error in your calculation. Recheck your input values, especially the upper and lower specification limits, as well as the mean and standard deviation.
Related Terms:
- free cpk calculator for excel
- cp cpk formula in excel
- cpk data chart using excel
- cp and cpk calculator excel
- cpk formula excel template
- cpk calculation formula


